Tools and Data
This note lists the tools and data for the cycle of physical and digital prototypes in Microclimate Design. It begins with the role and demonstrated precision of simulation at each design stage. It then gives a starter kit for each task, the evidence for each tool and the remaining gaps.
Related Notes
- Microclimate Design and Six Steps: the approach, the six steps and their evidence.
- Frog Sauna: the first case, with its measurement plan.
- Modelling, Measurement and Sensing: modelling and simulation, measurement, and sensors.
- Lidar, Imaging and Measurement: scanning, imaging and the measurement of habitat structures.
What Simulation Can Do at Each Stage
Simulation is feasible for small shelters. In successful cases, physics-based models predicted interior temperatures with mean errors of about 0.6 to 1.8 °C. That precision is enough to rank sites and design options that differ by several degrees. Reliable counts of hours above a threshold require a model calibrated against a built prototype. Outcomes for occupants require trials with occupied structures, especially when design differences are small.
| Stage | What simulation does there | Best evidence | Tools |
|---|---|---|---|
| Choosing sites and seasons | Generates hourly solar, air, wind and soil conditions at shelter height for candidate sites, supplying weather data for later models | Across Australia, the NicheMapR microclimate model explained about 85% of the variation in hourly soil temperature at 43 weather stations over ten years without site-specific calibration.1 With microclima, it can calculate terrain-corrected hourly microclimates for any site from 1957.2 | NicheMapR, microclima, SILO, BARRA or ERA5 grids, plus a site pyranometer and anemometer |
| Narrowing design options | Compares many variants before construction and identifies which inputs to measure first | ShelTherm, a reduced single-zone model, had a mean error of 0.94 °C across seven transitional shelters at the Azraq refugee camp in Jordan and 0.24 °C across three UK shelters, based on one day at each shelter. EnergyPlus had a mean error of 0.60 °C. First-time users modelled a shelter in 34 minutes on average.3 In the calibration at Azraq, air leakage affected predictions more than the conductivity of the insulation or soil.4 | Small resistance-capacitance models; ShelTherm; Ladybug and Radiance in Grasshopper; SALib for Morris screening and Latin hypercube sampling; then parametric models with Opossum for optimisation once a model is calibrated |
| Testing built prototypes without occupants | Calibrates a model with one built prototype and checks it against others | At Azraq, EnergyPlus models calibrated with one monitored shelter predicted six built variants better than uncalibrated models. Model performance ranked similarly in Jordan and South West England, supporting prototype tests away from the final site. All models still overpredicted temperatures in the two variants with added thermal mass.4 Pseudo-random heating over six days identified a four-state model of a 120 m² test building in Denmark.5 By contrast, free-running logs from a 120 cm test box overparameterised every model.6 | EnergyPlus, CTSM-R, COMSOL or OpenFOAM for air flow, heated and wet physical models, and climate-chamber replays7 |
| Occupied structures | Adds occupants' heat and moisture to the structure, then predicts body temperature, energy use and water loss | In Victoria, a model checked against respirometry showed that four huddling Leadbeater's possums remained thermoneutral down to 11.4 °C, compared with 26.5 °C for one possum alone.8 A copper model in a wet sleeve tracked live western toads from Idaho within 0.20 to 0.34 °C.9 In the one field test of roost designs with different temperatures, Indiana bats offset the differences by moving among roosts.10 | NicheMapR endotherm and ectotherm models, including the share of frog skin that acts as a free water surface; heated and wet physical models; and an empty twin beside each occupied unit |
| New sites and later versions | Recalibrates at the deployment site and carries learning from each round into the next design | A model calibrated at one solar greenhouse near Beijing had an error of 3.3 K at a second greenhouse.11 At Werribee, solar exposure and air temperature alone did not predict frog-shelter performance.12 No study has yet fed measured microclimate into a thermal model that then shaped the next version. | Bayesian calibration with an emulator, noting that a good fit can conceal incorrect parameter values;13 TRACE documentation14 |
- Models performed well for shaded structures. Models of small shaded structures, driven by air temperatures logged beside them, had mean errors of about 0.6 to 1.8 °C. An uncalibrated single-node heat-balance model, written in R, predicted conditions in 43 tree cavities and 27 den boxes used by American martens and fishers in Minnesota and Michigan over several months. Mean errors were 1.02 °C in den boxes and 1.77 °C in tree cavities.15 A steady heat-transfer model of a raccoon in a closed tree den at Cedar Creek, Minnesota, predicted the fur-surface temperature of a heated, fur-covered cylinder within 1.6 °C on average and its total heat loss within 5%.16
- Models performed worse for sunlit structures, which resemble a sauna. A transient model of two solar greenhouses near Beijing, built in Matlab and Simulink, had errors of 2.6 and 3.3 K.11 A model of pine processionary moth nests in France had mean errors of 4.31 to 5.25 °C despite a correlation above 0.9.17
- Agreement with a median is weak evidence. A COMSOL model of a honeybee hive came within 0.1 to 1.6 °C of the median hourly reading at four ambient temperatures. At one ambient temperature, however, readings spanned more than 20 °C, so the agreement says little about the prediction error.18
- Sensors set a lower error floor. In sun, shielded iButtons had root mean square (RMS) errors of at least 3.16 °C, whereas 0.08 mm thermocouples kept RMS errors within 0.93 °C.19
- The required precision depends on the decision. Measured design differences of 4.5 to 8 °C exceed these errors.20, 21, 22 By contrast, counts of hours above a threshold can change with errors of 1 to 2 °C. Model checks should therefore report predicted and measured hours in the target band as well as RMS error.
Site Weather
Starter kit. Use the NicheMapR microclimate model driven by daily SILO grids or hourly reanalyses (BARRA, ERA5). Add a site pyranometer, anemometer and unshielded fine-wire thermocouples to check it.
NicheMapR calculates hourly solar radiation, air, wind and soil conditions at shelter height from these inputs.23 Across Australia, when driven by daily gridded weather and monthly mean wind, it explained about 85% of the variation in hourly soil temperature.1 Weather-data choice matters. At United States reference stations in January and July 2017, switching the dataset that drove the models shifted a modelled lizard's mean operative temperature by up to 10 °C and its hours above the upper thermal limit by up to 150. No dataset suited every use.24 SILO is daily and has no wind data. Its rainfall record begins in 1890, while its temperature, radiation and vapour-pressure records begin in 1957. Only about 25 stations measure radiation, so SILO estimates it elsewhere from sunshine hours (r² = 0.85) or cloud oktas (r² = 0.71). Radiation was not included in the cross-validation that provides errors for the other variables.25
Solar Loads on the Geometry
Starter kit. Use Ladybug and Radiance within the Grasshopper model. Measure the solar reflectance of each finish with a spectrophotometer on small flat samples or with a portable reflectometer. Measure thermal emissivity separately.
Radiance predicted daylight in two full-size mock offices at the Building Research Establishment in the United Kingdom under four measured sky conditions. Mean error was 5.6% and never exceeded 13%.26 No study cited here tests Radiance's solar irradiance estimates on objects smaller than 1 m. The field methods for measuring reflectance require targets at least 1 m wide.27
The Structure
Starter kit. Fit a small resistance-capacitance model, covering envelope resistance, total heat capacity and solar aperture, to climate-chamber and field logs with CTSM-R. Use an imposed sequence, such as pseudo-random heating, to excite the shelter. Represent occupants as sources of heat and moisture. Use COMSOL or OpenFOAM for air flow through cavities and openings and along wet walls.
Six days of five-minute data from a 120 m² test building at Risø, Denmark, heated in a pseudo-random binary sequence, identified a four-state model. Total heat capacity and envelope resistance remained nearly constant across the larger models. The small heat capacities had no direct physical interpretation. Residuals peaked under strong sun.5 In a blind round robin with a 120 cm test box measured in Belgium and Spain, most teams estimated its heat-loss coefficient near the 4.08 W/K target. Free-running logs, with no heat supplied, nevertheless overparameterised the models.6
The Occupants
Starter kit. Use NicheMapR's ectotherm model with a frog body shape and a species-specific estimate of the skin area that acts as a free water surface.28 For birds and mammals, use NicheMapR's endotherm model to estimate metabolic heat production, respiratory evaporation and cutaneous evaporation.29 Use wet frog models, heated proxies and heated mounts to check heat and moisture exchange inside the structure in both directions.
A copper model in a wet cotton sleeve tracked the body temperature of live western toads from Idaho with mean errors of 0.34 °C while warming and 0.20 °C while cooling. It tracked evaporation within about 14%.9 Heated mounts of American goldfinches (Spinus tristis) from Michigan, calibrated against live birds, predicted metabolic heat production minus evaporative cooling within 5% below the thermoneutral zone in winds of 0 to 1.5 m/s. Reading heater power directly would have produced errors of 50 to 100%.30 A heated jar the size of a common ringtail possum warmed insulated nest boxes to 3 °C above the air.31 A review found that simplified models could read as much as 6 °C below the body temperature of desert spiny lizards (Sceloporus magister). Colour alone changed sunlit cylinder models by up to 12.5 °C. Only 21 of 54 studies published over 12 years reported any calibration.32 Printed models can represent dry-skinned occupants. Researchers printed hollow models from scans of eight lizard species in ABS, PLA and copper-filled PLA, then painted them to measured reflectance. The models matched live lizards in Puerto Rico and the continental United States with mean biases of 0.01 to 0.27 °C. Individual trials varied more widely, with standard deviations near 1.9 °C or 2.7 °C in sun.33
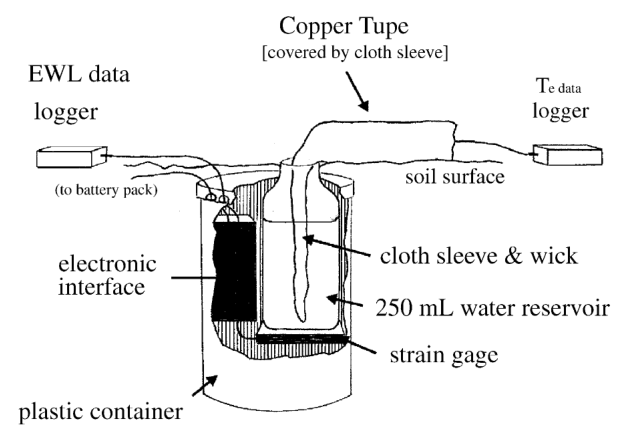
A copper-tube model of a toad in a wet cloth sleeve. A 250 mL water reservoir rests on a strain gauge that logs evaporative water loss, and the model also carries a logger for operative temperature.9
Calibration and the Next Design
Starter kit. Use Latin hypercube sampling, Morris screening and Bayesian calibration with an emulator.34 Then use Opossum to optimise the next prototype and TRACE to document each round.14
A case study calibrated an occupied 850 ft² building at the National Renewable Energy Laboratory in Colorado against monthly electricity use. It used Morris screening, 30 Latin hypercube runs and a Gaussian-process emulator. Posterior estimates lost precision with four or more parameters. Models that met ASHRAE Guideline 14 could have different posterior estimates, so a good fit does not show that calibrated values match the true material properties.13 In a simulated daylight-and-glare problem for a room in Singapore, Opossum's surrogate-model optimiser improved the objective by 50%, compared with about 40% for metaheuristic optimisers.35 SALib runs the sensitivity analyses.36
Measurement Inside and Around the Structure
Starter kit. Place sensors at occupants' positions inside the structure, at entrances and around it, including at the ground, water's edge and in vegetation. Keep an empty twin beside each occupied unit and a reference station in the open. Use 0.08 mm thermocouples for air in sun, iButtons or TMS loggers in shade, wet and dry occupant models, and sensors for humidity, wind and soil. Add a pyranometer and a thermal camera with measured emissivity.
On open grassland in Cornwall, United Kingdom, shielded iButtons had RMS errors no lower than 3.16 °C over day and night. Shielded TMS4 loggers overestimated air temperature by up to about 9 °C, while 0.08 mm thermocouples kept RMS error to 0.93 °C.19 Guidance from 26 microclimate researchers recommends unshielded ultra-fine-wire thermocouples in open, sunny habitats because shields heat in sun and obstruct airflow. It recommends standardised shields for other loggers.37 In water baths at 27 to 33 °C, 95% of iButton readings fell within about 0.5 °C of a reference thermocouple.38 TMS loggers measure at +15, 0 and −8 cm relative to the ground surface.39 In one pair of nest boxes, an empty twin isolated the effect of a bumblebee colony on its occupied box.40
Material Properties
Starter kit. Measure conductivity with a guarded heat-flow meter, hot wire or dual-probe heat pulse. The last method also estimates volumetric heat capacity.41 Test at several humidity levels and after wetting and salt exposure. Measure density, porosity, solar reflectance, thermal emissivity, sorption, vapour permeability and water absorption.
Conductivity rose with density, although density explained only about half the spread among fired clays (R² = 0.54). Bricks fired from nine commercial clays in northern Italy measured 0.33 to 0.56 W/m K at densities of 1643 to 1853 kg/m³. Hemp concretes tested at Rennes, France, measured 93 to 157 mW/m K at 258 to 460 kg/m³. A review reports 0.04 to 0.18 W/m K for mycelium composites.42, 43, 44 Moisture increased the conductivity of a light sprayed hemp concrete by one quarter at 90% relative humidity, the upper end of the study's range.43 Across the nine clays, extruded bodies ranged from 16% below to 23% above pressed bodies made from the same clay. The authors attribute part of this difference to pressure aligning clay minerals, so print direction may matter.42
Prototypes and Assembly
Starter kit. Use sketch rigs on site and test components and partial sections in a climate chamber that replays field temperatures and cycles humidity. Capture as-built geometry with laser scanning, photogrammetry or depth cameras. Use mixed-reality assembly, robotic fabrication and clay printing as appropriate.
A climate chamber in Stuttgart replayed temperatures recorded on a loggia to test bee panels, although it did not reproduce solar radiation.7 The Munich façade team compared 3D scans of full-scale tiles with their models and fed the deviations back into the design.45 In Hobart, two bricklayers following mixed-reality instructions laid 585 uniquely positioned reclaimed bricks in six and a half hours, within traditional bricklaying tolerances, in a test run by the tools' developers.46 At a CAADRIA 2018 workshop in Beijing, two teams of two people with no prior experience of the tools fabricated and assembled 92 unique bent-steel parts for a pavilion in three days.47 DDL assembled its printed owl cavities with augmented reality.48
Gaps
- No standard thermal test exists for nest boxes, roosts or frog shelters. The blind round robin with a test box shows one way to run such a test.6
- ASHRAE Guideline 14 sets calibration criteria for energy use only.49 The cited sources offer no comparable criteria for enclosure or body temperatures.
- Published exterior convection correlations come from flat plates, wind-tunnel cubes and full-scale building façades from 3 × 3 × 3 m to 30 m high. They also come from computational fluid dynamics models of a 10 m cube and a 6 × 8 × 2.7 m building.50 By this note's estimate, the wind-tunnel correlations cover Reynolds numbers relevant to shelters 0.3 to 1 m wide in light wind, but no study has tested them at that scale on the ground.
- Ceramic brick has interlaboratory data for moisture storage and transport, although vapour-resistance factors varied widely between laboratories.51 No measured property set exists for printed clay, and none of the cited material studies reports the thermal emissivity of a shelter finish.
References
Footnotes
Kearney, Michael R., Alireza Shamakhy, Reid Tingley, David J. Karoly, Ary A. Hoffmann, Peter R. Briggs, and Warren P. Porter. “Microclimate Modelling at Macro Scales: A Test of a General Microclimate Model Integrated with Gridded Continental-Scale Soil and Weather Data.” Methods in Ecology and Evolution 5, no. 3 (2014): 273–86. https://doi.org/10.1111/2041-210x.12148.˄
Kearney, Michael R., Phillipa K. Gillingham, Isobel Bramer, James P. Duffy, and Ilya M. D. Maclean. “A Method for Computing Hourly, Historical, Terrain-Corrected Microclimate Anywhere on Earth.” Methods in Ecology and Evolution 11, no. 1 (2020): 38–43. https://doi.org/10.1111/2041-210X.13330.˄
De Castro, Manuela, Noorullah Kuchai, Sukumar Natarajan, Kemi Adeyeye, Daniel Fosas, Francis Moran, Nick McCullen, Zu Wang, and David Coley. “ShelTherm: An Aid-Centric Thermal Model for Shelter Design.” Journal of Building Engineering 44 (2021): 102579. https://doi.org/10.1016/J.JOBE.2021.102579.˄
Fosas, Daniel, Francis Moran, Sukumar Natarajan, John Orr, and David Coley. “The Importance of Thermal Modelling and Prototyping in Shelter Design.” Building Research & Information 48, no. 4 (2020): 379–400. https://doi.org/10.1080/09613218.2019.1691489.˄
Bacher, Peder, and Henrik Madsen. “Identifying Suitable Models for the Heat Dynamics of Buildings.” Energy and Buildings 43, no. 7 (2011): 1511–22. https://doi.org/10.1016/j.enbuild.2011.02.005.˄
Roels, Staf, Peder Bacher, Geert Bauwens, Sergio Castaño, Maria José Jiménez, and Henrik Madsen. “On Site Characterisation of the Overall Heat Loss Coefficient: Comparison of Different Assessment Methods by a Blind Validation Exercise on a Round Robin Test Box.” Energy and Buildings 153 (2017): 179–89. https://doi.org/10.1016/j.enbuild.2017.08.006.˄
Valverde Rojas, Maria Claudia, Joel Kimmich, Doris Österreicher, Leonie K. Fischer, and Jan Knippers. “Designing More-than-Human Thermal Comfort: Bio-Inspired Evaporative Cooling in Porous Facade Components for Cavity-Nesting Wild Bees.” Frontiers in Built Environment 12 (2026): 1750586. https://doi.org/10.3389/fbuil.2026.1750586.˄
McComb, Leo, Pia E. Lentini, Dan K. P. Harley, Lindy F. Lumsden, Arabella Eyre, and Natalie J. Briscoe. “Climate and Behaviour Influence Thermal Suitability of Artificial Hollows for a Critically Endangered Mammal.” Animal Conservation 25, no. 3 (2022): 401–13. https://doi.org/10.1111/acv.12750.˄
Bartelt, Paul E., and Charles R. Peterson. “Physically Modeling Operative Temperatures and Evaporation Rates in Amphibians.” Journal of Thermal Biology 30, no. 2 (2005): 93–102. https://doi.org/10.1016/J.JTHERBIO.2004.07.007.˄
Crawford, Reed D., Luke E. Dodd, and Joy M. O’Keefe. “Do Artificial Roost Design and Placement Alter the Torpor Expression of Indiana Bats?” Journal of Thermal Biology 136 (2026): 104372. https://doi.org/10.1016/j.jtherbio.2026.104372.˄
Liu, Ran, Mengzhe Li, José Luis Guzmán, and Francisco Rodríguez. “A Fast and Practical One-Dimensional Transient Model for Greenhouse Temperature and Humidity.” Computers and Electronics in Agriculture 186 (2021): 106186. https://doi.org/10.1016/j.compag.2021.106186.˄
Holmes, Madeleine L., Shannon W. Kaiser, Sneha S. Basu, Lee Berger, Lee F. Skerratt, Richard Shine, and Anthony W. Waddle. “Disease Refuge or Ecological Trap: Location-Specific Performance of Amphibian Hotspot Shelters.” Ecology and Evolution 16, no. 4 (2026): e72590. https://doi.org/10.1002/ece3.72590.˄
Chong, Adrian, and Kathrin Menberg. “Guidelines for the Bayesian Calibration of Building Energy Models.” Energy and Buildings 174 (2018): 527–47. https://doi.org/10.1016/j.enbuild.2018.06.028.˄
Grimm, Volker, Jacqueline Augusiak, Andreas Focks, Béatrice M. Frank, Faten Gabsi, Alice S. A. Johnston, Chun Liu, et al. “Towards Better Modelling and Decision Support: Documenting Model Development, Testing, and Analysis Using TRACE.” Ecological Modelling 280 (2014): 129–39. https://doi.org/10.1016/j.ecolmodel.2014.01.018.˄
Velander, Taylor B., Michael J. Joyce, Angela M. Kujawa, Robert L. Sanders, Paul W. Keenlance, and Ron A. Moen. “A Dynamic Thermal Model for Predicting Internal Temperature of Tree Cavities and Nest Boxes.” Ecological Modelling 478 (2023): 110302. https://doi.org/10.1016/j.ecolmodel.2023.110302.˄
Thorkelson, Jeffrey, and Robert K. Maxwell. “Design and Testing of a Heat Transfer Model of a Raccoon (Procyon lotor) in a Closed Tree Den.” Ecology 55, no. 1 (1974): 29–39. https://doi.org/10.2307/1934615.˄
Poitou, Laura, Christelle Robinet, Christelle Suppo, Jérôme Rousselet, Mathieu Laparie, and Sylvain Pincebourde. “When Insect Pests Build Their Own Thermal Niche: The Hot Nest of the Pine Processionary Moth.” Journal of Thermal Biology 98 (2021): 102947. https://doi.org/10.1016/J.JTHERBIO.2021.102947.˄
Lu, Yuntao, Wei Hong, Wei Wu, Jie Zhang, Shijuan Li, Baohua Xu, Kun Wei, and Shengping Liu. “The Impact of Temperature Regulation Measures on the Thermodynamic Characteristics of Bee Colonies Based on Finite Element Simulation.” Biosystems Engineering 250 (2025): 306–16. https://doi.org/10.1016/j.biosystemseng.2025.01.012.˄
Maclean, Ilya M. D., James P. Duffy, Stef Haesen, Sanne Govaert, Pieter De Frenne, Thomas Vanneste, Jonathan Lenoir, Jonas J. Lembrechts, Marcus W. Rhodes, and Koenraad Van Meerbeek. “On the Measurement of Microclimate.” Methods in Ecology and Evolution 12, no. 8 (2021): 1397–410. https://doi.org/10.1111/2041-210X.13627.˄
Waddle, Anthony W., Simon Clulow, Amy Aquilina, Erin L. Sauer, Shannon W. Kaiser, Claire M. Miller, Jennifer A. Flegg, et al. “Hotspot Shelters Stimulate Frog Resistance to Chytridiomycosis.” Nature 631, no. 8020 (2024): 344–49. https://doi.org/10.1038/s41586-024-07582-y.˄
Griffiths, Stephen R., Jessica A. Rowland, Natalie J. Briscoe, Pia E. Lentini, Kathrine A. Handasyde, Linda F. Lumsden, and Kylie A. Robert. “Surface Reflectance Drives Nest Box Temperature Profiles and Thermal Suitability for Target Wildlife.” PLOS ONE 12, no. 5 (2017): e0176951. https://doi.org/10.1371/journal.pone.0176951.˄
Rowland, Jessica A., Natalie J. Briscoe, and Kathrine A. Handasyde. “Comparing the Thermal Suitability of Nest-Boxes and Tree-Hollows for the Conservation-Management of Arboreal Marsupials.” Biological Conservation 209 (2017): 341–48. https://doi.org/10.1016/j.biocon.2017.02.006.˄
Kearney, Michael R., and Warren P. Porter. “NicheMapR – an R Package for Biophysical Modelling: The Microclimate Model.” Ecography 40, no. 5 (2017): 664–74. https://doi.org/10.1111/ECOG.02360.˄
Meyer, Abigail V., Yutaro Sakairi, Michael R. Kearney, and Lauren B. Buckley. “A Guide and Tools for Selecting and Accessing Microclimate Data for Mechanistic Niche Modeling.” Ecosphere 14, no. 4 (2023): e4506. https://doi.org/10.1002/ecs2.4506.˄
Jeffrey, Stephen J., John O. Carter, Keith B. Moodie, and Alan R. Beswick. “Using Spatial Interpolation to Construct a Comprehensive Archive of Australian Climate Data.” Environmental Modelling & Software 16, no. 4 (2001): 309–30. https://doi.org/10.1016/s1364-8152(01)00008-1.˄
Mardaljevic, John. “Validation of a Lighting Simulation Program under Real Sky Conditions.” Lighting Research & Technology 27, no. 4 (1995): 181–88. https://doi.org/10.1177/14771535950270040701.˄
Levinson, Ronnen, Hashem Akbari, and Paul Berdahl. “Measuring Solar Reflectance—Part II: Review of Practical Methods.” Solar Energy 84, no. 9 (2010): 1745–59. https://doi.org/10.1016/j.solener.2010.04.017.˄
Kearney, Michael R., and Warren P. Porter. “NicheMapR – an R Package for Biophysical Modelling: The Ectotherm and Dynamic Energy Budget Models.” Ecography 43, no. 1 (2020): 85–96. https://doi.org/10.1111/ecog.04680.˄
Kearney, Michael R., Natalie J. Briscoe, Paul D. Mathewson, and Warren P. Porter. “NicheMapR – an R Package for Biophysical Modelling: The Endotherm Model.” Ecography 44, no. 11 (2021): 1595–605. https://doi.org/10.1111/ecog.05550.˄
Bakken, George S., William A. Buttemer, William R. Dawson, and David M. Gates. “Heated Taxidermic Mounts: A Means of Measuring the Standard Operative Temperature Affecting Small Animals.” Ecology 62, no. 2 (1981): 311–18. https://doi.org/10.2307/1936705.˄
Kearney, Michael R., Emma Ferguson, Sarah Fumei, Anthony Gallacher, Peter Mitchell, Romy Woodford, and Kathrine A. Handasyde. “A Cost-Effective Method of Assessing Thermal Habitat Quality for Endotherms.” Austral Ecology 36, no. 3 (2011): 297–302. https://doi.org/10.1111/j.1442-9993.2010.02150.x.˄
Dzialowski, Edward M. “Use of Operative Temperature and Standard Operative Temperature Models in Thermal Biology.” Journal of Thermal Biology 30, no. 4 (2005): 317–34. https://doi.org/10.1016/J.JTHERBIO.2005.01.005.˄
Alujević, Karla, Leah Bakewell, Ian T. Clifton, Christian L. Cox, Luke O. Frishkoff, Eric J. Gangloff, Guillermo Garcia-Costoya, et al. “3D Printed Models Are an Accurate, Cost-Effective, and Reproducible Tool for Quantifying Terrestrial Thermal Environments.” Journal of Thermal Biology 119 (2024): 103762. https://doi.org/10.1016/j.jtherbio.2023.103762.˄
Kennedy, Marc C., and Anthony O’Hagan. “Bayesian Calibration of Computer Models.” Journal of the Royal Statistical Society Series B: Statistical Methodology 63, no. 3 (2001): 425–64. https://doi.org/10.1111/1467-9868.00294.˄
Wortmann, Thomas. “Model-Based Optimization for Architectural Design: Optimizing Daylight and Glare in Grasshopper.” Technology|Architecture + Design 1, no. 2 (2017): 176–85. https://doi.org/10.1080/24751448.2017.1354615.˄
Herman, Jon, and Will Usher. “SALib: An Open-Source Python Library for Sensitivity Analysis.” Journal of Open Source Software 2, no. 9 (2017): 97. https://doi.org/10.21105/joss.00097.˄
De Frenne, Pieter, Rémy Beugnon, David Klinges, Jonathan Lenoir, Pekka Niittynen, Sylvain Pincebourde, Rebecca A. Senior, et al. “Ten Practical Guidelines for Microclimate Research in Terrestrial Ecosystems.” Methods in Ecology and Evolution 16, no. 2 (2025): 269–94. https://doi.org/10.1111/2041-210X.14476.˄
Staines, Melissa N., David T. Booth, Jacques-Oliver Laloë, Ian R. Tibbetts, and Graeme C. Hays. “The Ecological Importance of the Accuracy of Environmental Temperature Measurements.” Biology Letters 18, no. 8 (2022): 20220263. https://doi.org/10.1098/rsbl.2022.0263.˄
Wild, Jan, Martin Kopecký, Martin Macek, Martin Šanda, Jakub Jankovec, and Tomáš Haase. “Climate at Ecologically Relevant Scales: A New Temperature and Soil Moisture Logger for Long-Term Microclimate Measurement.” Agricultural and Forest Meteorology 268 (2019): 40–47. https://doi.org/10.1016/J.AGRFORMET.2018.12.018.˄
Roberts, Jenny, Philip Donkersley, Grace Kelly, Stephen Quayle, and Allan Rennie. “Engineering Design and Development of an Artificial Bumblebee Nestbox (BeeBox).” International Journal of Sustainable Engineering 19, no. 1 (2026): 2735277. https://doi.org/10.1080/19397038.2026.2735277.˄
Bristow, Keith L., Gerard J. Kluitenberg, and Robert Horton. “Measurement of Soil Thermal Properties with a Dual-Probe Heat-Pulse Technique.” Soil Science Society of America Journal 58, no. 5 (1994): 1288–94. https://doi.org/10.2136/sssaj1994.03615995005800050002x.˄
Gualtieri, Magdalena Lassinantti, Alessandro F. Gualtieri, Silvio Gagliardi, Petra Ruffini, Roberto Ferrari, and Miriam Hanuskova. “Thermal Conductivity of Fired Clays: Effects of Mineralogical and Physical Properties of the Raw Materials.” Applied Clay Science 49, no. 3 (2010): 269–75. https://doi.org/10.1016/j.clay.2010.06.002.˄
Collet, Florence, and Sylvie Pretot. “Thermal Conductivity of Hemp Concretes: Variation with Formulation, Density and Water Content.” Construction and Building Materials 65 (2014): 612–19. https://doi.org/10.1016/j.conbuildmat.2014.05.039.˄
Jones, Mitchell, Andreas Mautner, Stefano Luenco, Alexander Bismarck, and Sabu John. “Engineered Mycelium Composite Construction Materials from Fungal Biorefineries: A Critical Review.” Materials & Design 187 (2020): 108397. https://doi.org/10.1016/j.matdes.2019.108397.˄
Larikova, Julia, Sofia Tsiotou, Alexander Haynack, David Briels, Fabio Sweet, Wolfgang Weisser, and Kathrin Dörfler. “Additively Manufactured Ceramic Façades for Biodiversity and Climatic Performance Integration: A Full-Scale Case Study.” Additive Manufacturing 130 (2026): 105395. https://doi.org/10.1016/j.addma.2026.105395.˄
Jahn, Gwyllim, Cameron Newnham, Nick van den Berg, Melissa Iraheta, and Jackson Wells. “Holographic Construction.” In Impact: Design with All Senses, edited by Christoph Gengnagel, Olivier Baverel, Jane Burry, Mette Ramsgaard Thomsen, and Stefan Weinzierl, 314–24. Cham: Springer, 2020. https://doi.org/10.1007/978-3-030-29829-6_25.˄
Jahn, Gwyllim, Cameron Newnham, Nick van den Berg, and Matthew Beanland. “Making in Mixed Reality: Holographic Design, Fabrication, Assembly and Analysis of Woven Steel Structures.” In Recalibration: On Imprecision and Infidelity: Proceedings of the 38th Annual Conference of the Association for Computer Aided Design in Architecture (ACADIA), edited by Phillip Anzalone, Marcella del Signore, and Andrew John Wit, 88–97. Mexico City: ACADIA, 2018. https://doi.org/10.52842/conf.acadia.2018.088.˄
Parker, Dan, Stanislav Roudavski, Therésa M. Jones, Nick Bradsworth, Bronwyn Isaac, Martin T. Lockett, and Kylie Soanes. “A Framework for Computer-Aided Design and Manufacturing of Habitat Structures for Cavity-Dependent Animals.” Methods in Ecology and Evolution 13, no. 4 (2022): 826–41. https://doi.org/10.1111/2041-210x.13806.˄
Coakley, Daniel, Paul Raftery, and Marcus Keane. “A Review of Methods to Match Building Energy Simulation Models to Measured Data.” Renewable and Sustainable Energy Reviews 37 (2014): 123–41. https://doi.org/10.1016/j.rser.2014.05.007.˄
Defraeye, Thijs, Bert Blocken, and Jan Carmeliet. “Convective Heat Transfer Coefficients for Exterior Building Surfaces: Existing Correlations and CFD Modelling.” Energy Conversion and Management 52, no. 1 (2011): 512–22. https://doi.org/10.1016/j.enconman.2010.07.026.˄
Roels, Staf, Jan Carmeliet, Hugo Hens, Olaf Adan, Harold Brocken, Robert Cerny, Zbysek Pavlik, et al. “Interlaboratory Comparison of Hygric Properties of Porous Building Materials.” Journal of Thermal Envelope and Building Science 27, no. 4 (2004): 307–25. https://doi.org/10.1177/1097196304042119.˄
Backlinks