Dissemination
This note describes how research images reach readers beyond the research: in deep maps and story maps, in data stories, through citizen science and in investigations that seek legal or political change. It also collects the experimental evidence on what images do to viewers, which is mixed and includes several null results. The note develops principles 9, 10 and 12 of Photography.
Status: working draft of 10 November 2026.
Related Notes
- Photography: the principles.
- Mapping: deep maps and spatial narratives, with the foundational sources.
- Co-production: maps, exhibitions and images made with knowledge holders.
- Templates: captions and metadata that keep images interpretable.
- Research Impact and Presentations: impact and presentation of research.
- Video: the lab's rules for video.
Deep Maps and Story Maps
Deep maps layer images, voices, texts and data on a place, so that readers meet the place's ecology and its human experience together.
- One account treats deep mapping as a practice performed in and with a place, open to many disciplines, rather than as a fixed set of cartographic features.1 Another links deep mapping with flat ontologies and the democratising of knowledge.2
- Interactive deep maps can link residents' lived experience with mapped ecological data, which suits conservation that must answer to both.3
- A deep chart of water, built on Google Earth with the Tlingit and Tagish peoples, supported their work towards Indigenous water legislation.4
- An augmented-reality deep map in a state park placed climate change within the visitor's local community.5
- Qualitative "messy maps" of informal settlements in Nairobi and Cape Town put emotion, social ties and experience beside GIS data, and planners found that the added detail helped them remember and understand resilience.6
Data Stories
Data stories join narrative with visualisation, and they range from stories that the author drives to stories that the reader explores.7 Map-based stories have their own genres and tropes, which a review of cartographic storytelling sets out.8 Residents who sensed air pollution near fracking sites produced "just good enough" data and used data stories to interpret it in ways that went beyond regulation and compliance.9
Citizen Science with Images
Volunteers classify images at scales that research teams cannot reach, and well-designed projects check their work against experts.
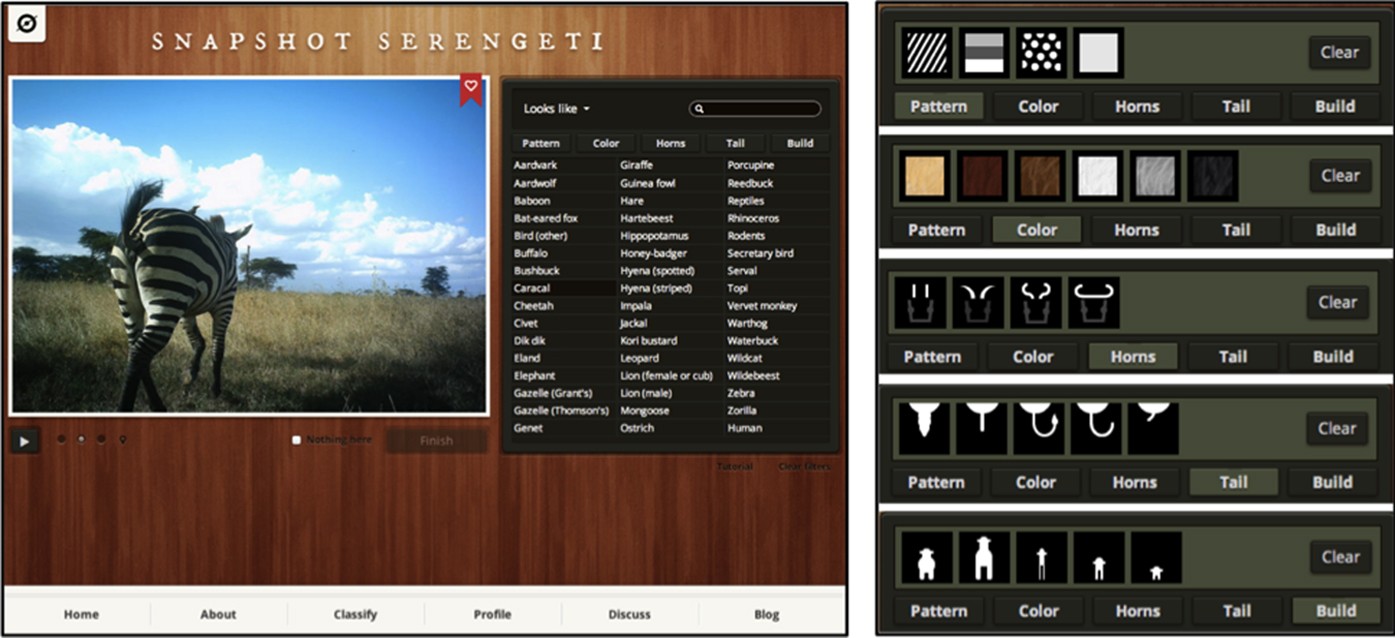
The Snapshot Serengeti interface, where volunteers identified species, counted animals and described behaviour in camera-trap images.10
- On Snapshot Serengeti, volunteers classified 1.2 million sets of camera-trap images,10 and their combined answers matched experts for 98 per cent of images.11
- Penguin Watch released time-lapse images of Antarctic colonies together with the clicks of volunteers who marked each penguin.12
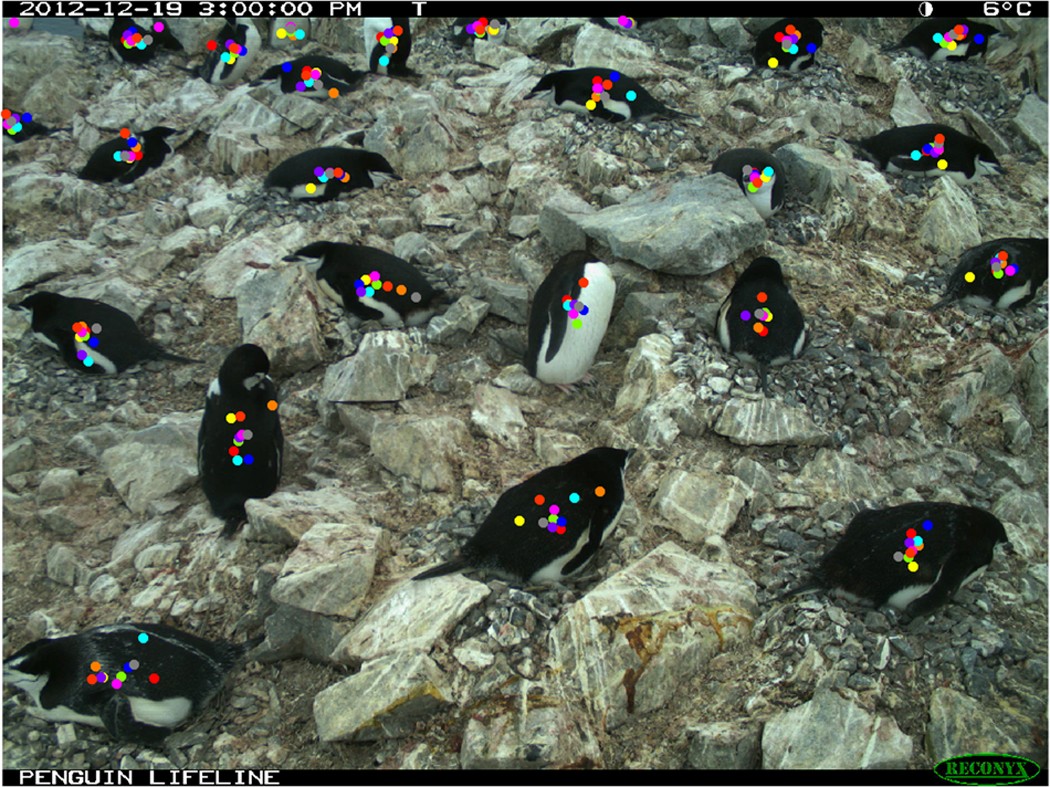
A Penguin Watch time-lapse image with the clicks of ten volunteers, each marking the penguins they saw.12
- On Deep Lake Explorer, volunteers classified underwater video of the Laurentian Great Lakes and agreed with experts on 77 to 90 per cent of videos, depending on the attribute.13
- CoastSnap turns photographs that passers-by take from fixed smartphone cradles into measurements of beaches worldwide.14, 15 Citizen drone pilots surveyed 28 sites on the Victorian coast more than 450 times.16
- After the BBC featured a do-it-yourself wildlife camera on television, people built more than 1,000 of them from the project's instructions, without contact with the designers.17 Ten residents who used camera traps in their gardens found trade-offs between controlling and caring for the animals they watched, and shared the footage within their households.18
Investigations and Policy
Images become evidence in disputes when investigators combine them with other records.
- Forensic Architecture combines architectural analysis with photographs, video and testimony, increasingly recorded by the people who lived through the events, and presents its findings to courts and citizen-organised truth commissions.19
- Communities in the Ecuadorian Amazon mapped 295 gas flares that official datasets and satellite imagery had missed, and their data supported a court ruling in 2021 that ordered flaring to stop.20
- Baited underwater video at 371 reefs in 58 nations recorded no sharks on almost 20 per cent of reefs and linked their abundance to markets, governance and fishing rules, which identified pathways for policy.21
What Images Do to Viewers
The evidence on effects is mixed. Some studies find strong effects of particular images, others find none, and many results depend on the place and the audience. A scoping review of 37 studies found clear evidence that animal images can improve attitudes, but few comparable data on effectiveness and little that generalises beyond the study's context.22 Popular moving images also evoke animals through distinct affective logics. A study of images of elephants mapped four registers of popular imagery, such as the sentimentality of mainstream animation, and argued that these images affect living elephants as they reshape cultural sensibilities, ethical values and policy.23
Effects found
- Images of chimpanzees with a human, or in human settings such as an office, made viewers more likely to see chimpanzees as appealing pets and to think wild populations were healthy.24 Zoo photographs showed the same pattern: the closer the human, the more viewers judged the animal's behaviour unnatural and the animal a good pet.25
- Animal portraits raised empathy compared with conventional wildlife photographs.26
- Across three studies, more aesthetic nature images drew more engagement on social media and more moral concern, through awe, inspiration and a sense of purity.27
- In articles about a water crisis, data visualisations changed readers' attitudes and moved them emotionally more than illustrations did.28
- Viewers consistently remembered some visualisations better than others: colour and recognisable objects made them more memorable.29
No effect found
- Captions that framed images of humans touching primates as research did not reduce viewers' wish to keep primates as pets.30
- Maps and photographs added to climate stories did not change how absorbed readers became; the structure of the story and prior beliefs mattered more.31
- Video stories from local residents changed perceptions of sea-level rise no more than written quotations, although participants found them compelling.32
Practice for the Lab
- Test the image with its audience where the stakes are high, because intuition about effects often fails.
- Avoid images that place humans in contact with wild animals unless the research requires it.
- Release images with their metadata and volunteers' annotations, so that others can reuse both.
- Keep the measurement stream and the communication stream from the same cameras where possible (principle 9 of Photography).
Open Questions
- Would a deep map of the eel project, joining sonar, video, eDNA and the knowledge of fishers and Traditional Owners, change how city planners treat urban waterways?
- Which images of eels, an animal many viewers find unappealing, raise concern without misleading?
References
Footnotes
Roberts, Les. “Deep Mapping and Spatial Anthropology.” Humanities 5, no. 1 (2016): 5. https://doi.org/10.3390/h5010005.˄
Springett, Selina. “Going Deeper or Flatter: Connecting Deep Mapping, Flat Ontologies and the Democratizing of Knowledge.” Humanities 4, no. 4 (2015): 623–36. https://doi.org/10.3390/h4040623.˄
Eanes, Francis R., Janet M. Silbernagel, Patrick Robinson, and David A. Hart. “Interactive Deep Maps and Spatial Narratives for Landscape Conservation and Public Engagement.” Landscape Journal 38, nos. 1–2 (2019): 7–24. https://doi.org/10.3368/lj.38.1-2.7.˄
Hayman, Eleanor, Mark Wedge, and Colleen James. “A Deep Chart (the Aqua-Face of Deep Mapping): Collaborative Water Research with Carcross/Tagish First Nation, Shaanakhéeni Headwaters, Yukon Territory/British Columbia, Canada.” International Journal of Humanities and Arts Computing 11, no. 1 (2017): 86–108. https://doi.org/10.3366/ijhac.2017.0180.˄
Butts, Shannon, and Madison Jones. “Deep Mapping for Environmental Communication Design.” Communication Design Quarterly 9, no. 1 (2021): 4–19. https://doi.org/10.1145/3437000.3437001.˄
Taylor, Faith E., James D. A. Millington, Ezekiel Jacob, Bruce D. Malamud, and Mark Pelling. “Messy Maps: Qualitative GIS Representations of Resilience.” Landscape and Urban Planning 198 (2020): 103771. https://doi.org/10.1016/j.landurbplan.2020.103771.˄
Segel, Edward, and Jeffrey Heer. “Narrative Visualization: Telling Stories with Data.” IEEE Transactions on Visualization and Computer Graphics 16, no. 6 (2010): 1139–48. https://doi.org/10.1109/tvcg.2010.179.˄
Roth, Robert E. “Cartographic Design as Visual Storytelling: Synthesis and Review of Map-Based Narratives, Genres, and Tropes.” The Cartographic Journal 58, no. 1 (2021): 83–114. https://doi.org/10.1080/00087041.2019.1633103.˄
Gabrys, Jennifer, Helen Pritchard, and Benjamin Barratt. “Just Good Enough Data: Figuring Data Citizenships through Air Pollution Sensing and Data Stories.” Big Data & Society 3, no. 2 (2016): 2053951716679677. https://doi.org/10.1177/2053951716679677.˄
Swanson, Alexandra, Margaret Kosmala, Chris Lintott, Robert Simpson, Arfon Smith, and Craig Packer. “Snapshot Serengeti, High-Frequency Annotated Camera Trap Images of 40 Mammalian Species in an African Savanna.” Scientific Data 2, no. 1 (2015): 150026. https://doi.org/10.1038/sdata.2015.26.˄
Swanson, Alexandra, Margaret Kosmala, Chris Lintott, and Craig Packer. “A Generalized Approach for Producing, Quantifying, and Validating Citizen Science Data from Wildlife Images.” Conservation Biology 30, no. 3 (2016): 520–31. https://doi.org/10.1111/cobi.12695.˄
Jones, Fiona M., Campbell Allen, Carlos Arteta, Joan Arthur, Caitlin Black, Louise M. Emmerson, Robin Freeman, et al. “Time-Lapse Imagery and Volunteer Classifications from the Zooniverse Penguin Watch Project.” Scientific Data 5, no. 1 (2018): 180124. https://doi.org/10.1038/sdata.2018.124.˄
Wick, Molly J., Ted R. Angradi, Matthew B. Pawlowski, David Bolgrien, Rick Debbout, Jonathon Launspach, and Mari Nord. “Deep Lake Explorer: A Web Application for Crowdsourcing the Classification of Benthic Underwater Video from the Laurentian Great Lakes.” Journal of Great Lakes Research 46, no. 5 (2020): 1469–78. https://doi.org/10.1016/j.jglr.2020.07.009.˄
Harley, Mitchell D., and Michael A. Kinsela. “CoastSnap: A Global Citizen Science Program to Monitor Changing Coastlines.” Continental Shelf Research 245 (2022): 104796. https://doi.org/10.1016/j.csr.2022.104796.˄
Harley, Mitchell D., Michael A. Kinsela, Elena Sánchez-García, and Kilian Vos. “Shoreline Change Mapping Using Crowd-Sourced Smartphone Images.” Coastal Engineering 150 (2019): 175–89. https://doi.org/10.1016/j.coastaleng.2019.04.003.˄
Ierodiaconou, Daniel, David M. Kennedy, Nicolas Pucino, Blake M. Allan, R. Jak McCarroll, Lawrance W. Ferns, Rafael C. Carvalho, Karina Sorrell, Chloe Leach, and Mary Young. “Citizen Science Unoccupied Aerial Vehicles: A Technique for Advancing Coastal Data Acquisition for Management and Research.” Continental Shelf Research 244 (2022): 104800. https://doi.org/10.1016/j.csr.2022.104800.˄
Gaver, William, Andy Boucher, Michail Vanis, Andy Sheen, Dean Brown, Liliana Ovalle, Naho Matsuda, Amina Abbas-Nazari, and Robert Phillips. “My Naturewatch Camera: Disseminating Practice Research with a Cheap and Easy DIY Design.” Proceedings of the 2019 CHI Conference on Human Factors in Computing Systems, 2019, 1–13. https://doi.org/10.1145/3290605.3300532.˄
Vella, Kellie, Bernd Ploderer, and Margot Brereton. “Human-Nature Relations in Urban Gardens: Explorations with Camera Traps.” Proceedings of the 2021 CHI Conference on Human Factors in Computing Systems, 2021, 1–13. https://doi.org/10.1145/3411764.3445438.˄
Weizman, Eyal. Forensic Architecture: Violence at the Threshold of Detectability. New York: Zone Books, 2017.˄
Facchinelli, Francesco, Salvatore Eugenio Pappalardo, Giuseppe Della Fera, Edoardo Crescini, Daniele Codato, Alberto Diantini, Donald Rafael Moncayo Jimenez, Pablo Estenio Fajardo Mendoza, Elisa Bignante, and Massimo De Marchi. “Extreme Citizens Science for Climate Justice: Linking Pixel to People for Mapping Gas Flaring in Amazon Rainforest.” Environmental Research Letters 17, no. 2 (2022): 024003. https://doi.org/10.1088/1748-9326/ac40af.˄
MacNeil, M. Aaron, Demian D. Chapman, Michelle Heupel, Colin A. Simpfendorfer, Michael Heithaus, Mark Meekan, Euan Harvey, et al. “Global Status and Conservation Potential of Reef Sharks.” Nature 583, no. 7818 (2020): 801–6. https://doi.org/10.1038/s41586-020-2519-y.˄
Thomas-Walters, Laura, Claire McNulty, and Diogo Veríssimo. “A Scoping Review into the Impact of Animal Imagery on Pro-Environmental Outcomes.” Ambio 49, no. 6 (2020): 1135–45. https://doi.org/10.1007/s13280-019-01271-1.˄
Lorimer, Jamie. “Moving Image Methodologies for More-than-Human Geographies.” Cultural Geographies 17, no. 2 (2010): 237–58. https://doi.org/10.1177/1474474010363853.˄
Ross, Stephen R., Vivian M. Vreeman, and Elizabeth V. Lonsdorf. “Specific Image Characteristics Influence Attitudes about Chimpanzee Conservation and Use as Pets.” PLoS ONE 6, no. 7 (2011): e22050. https://doi.org/10.1371/journal.pone.0022050.˄
Shaw, Meghan N., Emily M. McLeod, William T. Borrie, and Kelly K. Miller. “Human Positioning in Close-Encounter Photographs and the Effect on Public Perceptions of Zoo Animals.” Animals 12, no. 1 (2021): 11. https://doi.org/10.3390/ani12010011.˄
Whitley, Cameron Thomas, Linda Kalof, and Tim Flach. “Using Animal Portraiture to Activate Emotional Affect.” Environment and Behavior 53, no. 8 (2021): 837–63. https://doi.org/10.1177/0013916520928429.˄
Kim, Eunsoo, Julia Lee Cunningham, and Anocha Aribarg. “The Moral Significance of Aesthetics in Nature Imagery.” Psychological Science 33, no. 9 (2022): 1372–85. https://doi.org/10.1177/09567976221083543.˄
Garretón, Manuela, Francesca Morini, Pablo Celhay, Marian Dörk, and Denis Parra. “Attitudinal Effects of Data Visualizations and Illustrations in Data Stories.” IEEE Transactions on Visualization and Computer Graphics 30, no. 7 (2024): 4039–54. https://doi.org/10.1109/tvcg.2023.3248319.˄
Borkin, Michelle A., Azalea A. Vo, Zoya Bylinskii, Phillip Isola, Shashank Sunkavalli, Aude Oliva, and Hanspeter Pfister. “What Makes a Visualization Memorable?” IEEE Transactions on Visualization and Computer Graphics 19, no. 12 (2013): 2306–15. https://doi.org/10.1109/tvcg.2013.234.˄
Freund, Cathryn A., Katherine A. Cronin, Michelle Huang, Natalie J. Robinson, Boaz Yoo, and Andrea L. DiGiorgio. “Effects of Captions on Viewers’ Perceptions of Images Depicting Human-Primate Interaction.” Conservation Biology 38, no. 3 (2024): e14199. https://doi.org/10.1111/cobi.14199.˄
Garrison, Michala A., Schyler A. Reis, Shiyu Zhang, and Carolyn S. Fish. “Narrative Transportation and Emotional Responses to Storytelling Maps.” Cartography and Geographic Information Science 53, no. 5 (2026): 618–38. https://doi.org/10.1080/15230406.2025.2526847.˄
Richards, Daniel P., and Sonia H. Stephens. “Do Voices Really Make a Difference? Investigating the Value of Local Video Narratives in Risk Perceptions and Attitudes towards Sea-Level Rise.” Technical Communication 69, no. 4 (2022): 79–96. https://doi.org/10.55177/tc105639.˄
Backlinks