Scanning and Modelling
Goals
Establish an evidence-design-evaluation loop for oyster reef restoration projects, using Ostrea angasi as a case study.
Workflow
- Measure natural reef geometry.
- Extract multiscale structural metrics.
- Identify which metrics correlate with live oyster density, recruit survival, habitat provision, and persistence.
- Generate artificial structures that vary the most relevant metrics.
- Deploy, monitor, and re-measure.
- Update the design rules from measured outcomes.
Baseline Measurement
Measurements of structural properties provide opportunities to:
- Assess ecosystem services.
- Create benchmarks and targets for design.
Existing datasets:
- Point clouds and 3D meshes of Ostrea angasi in NSW, obtained through photogrammetry, using mobile phones.
Actions:
- Record reef geometry at multiple scales: individual shell, shell cluster, patch, and host-site scale.
Technologies:
Acquire and compare the quality and promise of the datasets.
- Photogrammetry (current done with mobile phones).
- Handheld lidar (e.g., structure from motion)
- Structure sensor.
- Backpack lidar.
- Bathymetric and side-scan sonar.
Growth and Reef Formation
- Scan the structure on a given host site annually to obtain growth data.
Evidence Limits
- Much of modelling comes from species other than Ostrea angasi.
- Remote sensing is well supported for intertidal reef morphology, condition, and monitoring. Fine-scale shell-orientation and settlement-surface effects still need local calibration.
- Settlement cues may not be only geometric or hydrodynamic. Cf. sound cues.
Analysis
Metric categories:
Reef / Patch Geometry
-
Area. Plan-view footprint of reef substrate or an identified reef patch. Larger area can be associated with better persistence and higher oyster densities; smaller area can be associated with stronger degradation.
-
Volume. Three-dimensional amount of reef material or reef form.
-
Vertical relief / reef height. Elevation of the reef above the surrounding seabed or bottom. Larger relief generally indicates better habitat and lower degradation; low relief can be linked to greater sedimentation risk.
-
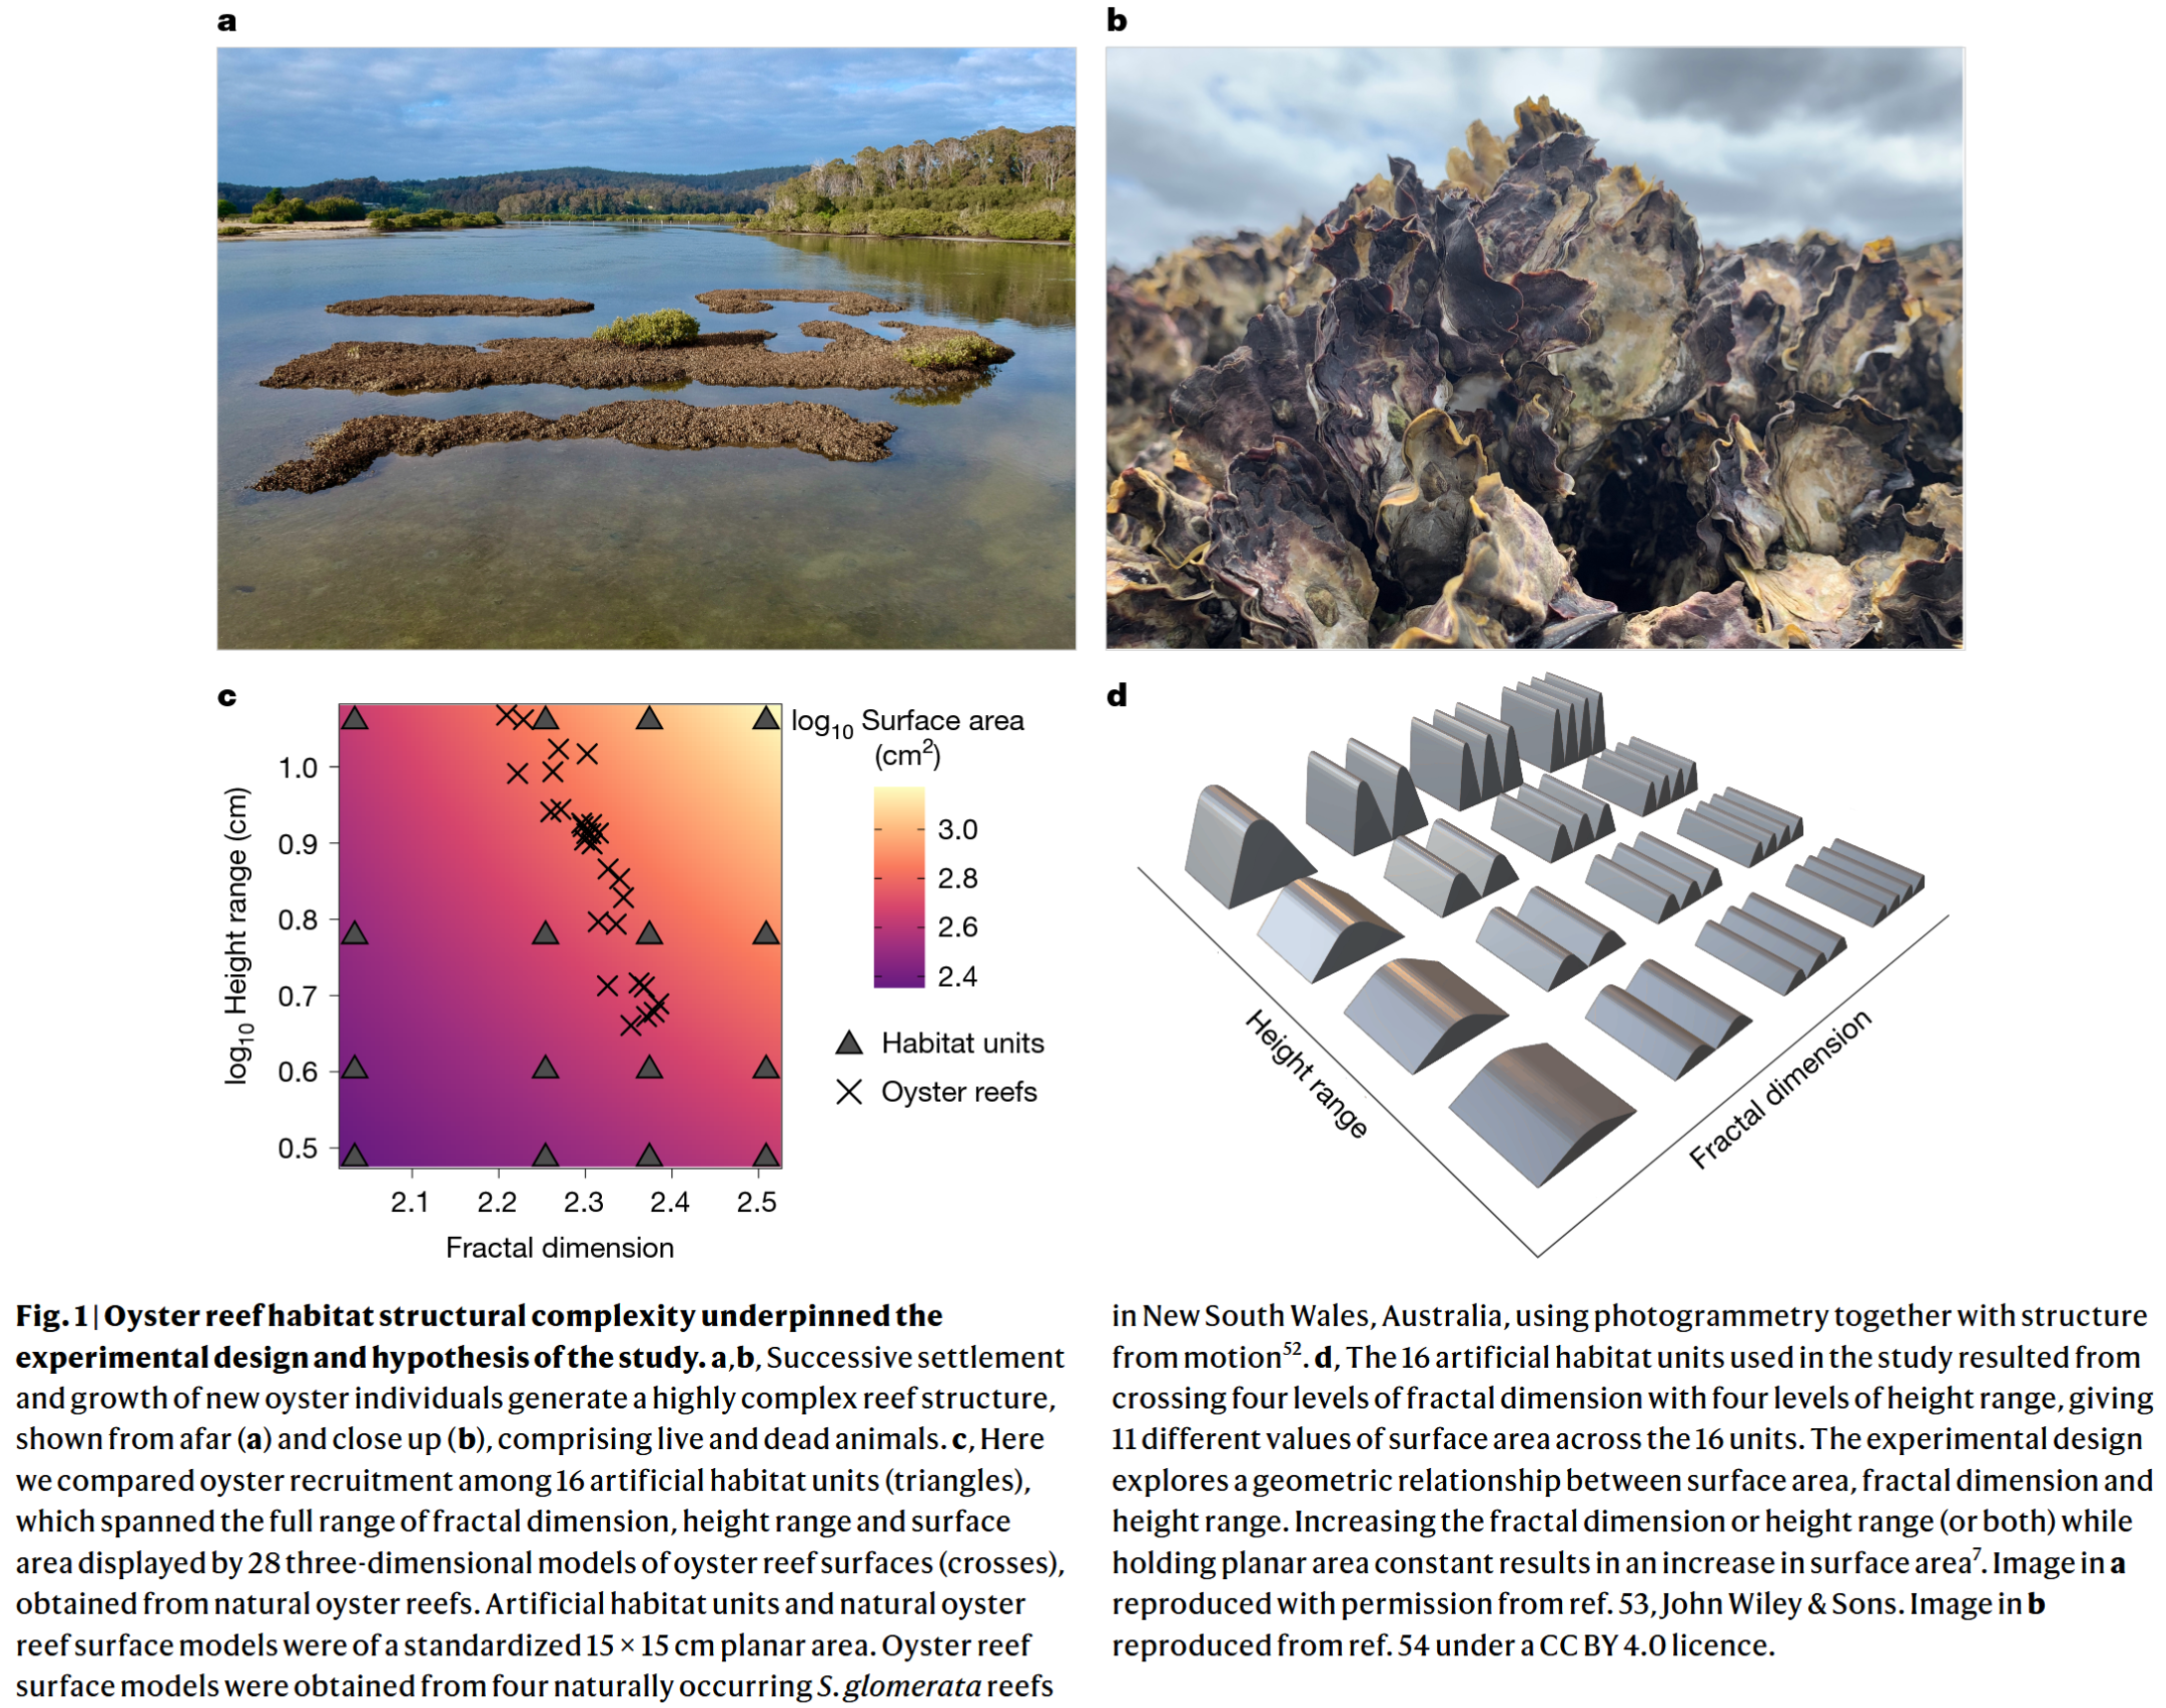
Height range. Spread between lower and higher parts of the reef surface. It is used as a structural complexity variable in artificial habitat work.
-
Perimeter-to-area ratio. Perimeter length divided by area; used as a proxy for fragmentation. Larger values generally indicate more edge and more fragmented shapes; lower values are associated with better restoration performance.
-
Patch size / reef size. Size of an individual reef patch or restored reef unit, often measured by area or length. Larger reefs generally support higher oyster and macrofaunal densities; smaller reefs are more prone to degradation or sedimentation effects.
-
Continuity versus discreteness of reef footprint. Whether reef substrate forms one continuous footprint or separated patches/mounds. Continuous flats give more total oysters per restored area or per substrate volume; discrete high-relief mounds give higher on-reef oyster and epifauna densities.
-
Fragmentation / pitting. Degree to which the reef surface is broken up, patchy, or pitted. Larger fragmentation / deeper pitting indicates stronger degradation.
-
Reef height (RH) — Height of the reef above the reef bottom elevation. Larger RH generally indicates less degradation.
-
Theoretical reef height (TRH) — Interpolated “expected” reef height after excluding concave areas/pits. It is used as a smooth reference height for comparison with actual RH.
-
Volume Balance Index (VBI = RH/TRH) — Ratio of actual reef height to theoretical reef height; used to indicate fragmentation/pitting. Lower VBI means more fragmentation / deeper pitting; higher VBI means less fragmentation. Zhuang et al. suggest that VBI < 0.6 as a criterion for severe degradation.
Surface Complexity
- Rugosity.
- Surface area.
- Slope.
- Curvature.
- Roughness.
- Fractal dimension.
- Vertical complexity.
Texture and Condition Metrics
Candidate reef-condition indicators?
- Volume-to-area ratio. Predictive models of live oyster density.
- GLCM = Gray-Level Co-Occurrence Matrix homogeneity.
- GLCM variance.
- Standard deviation of normals.
- Skewness-related elevation descriptors.
Porosity and Interstitial Structure
- Porosity and interstitial space as indicators of water flow, nutrient exchange, and habitat quality.
- Weight per unit volume.
Simulation and Design
Inputs:
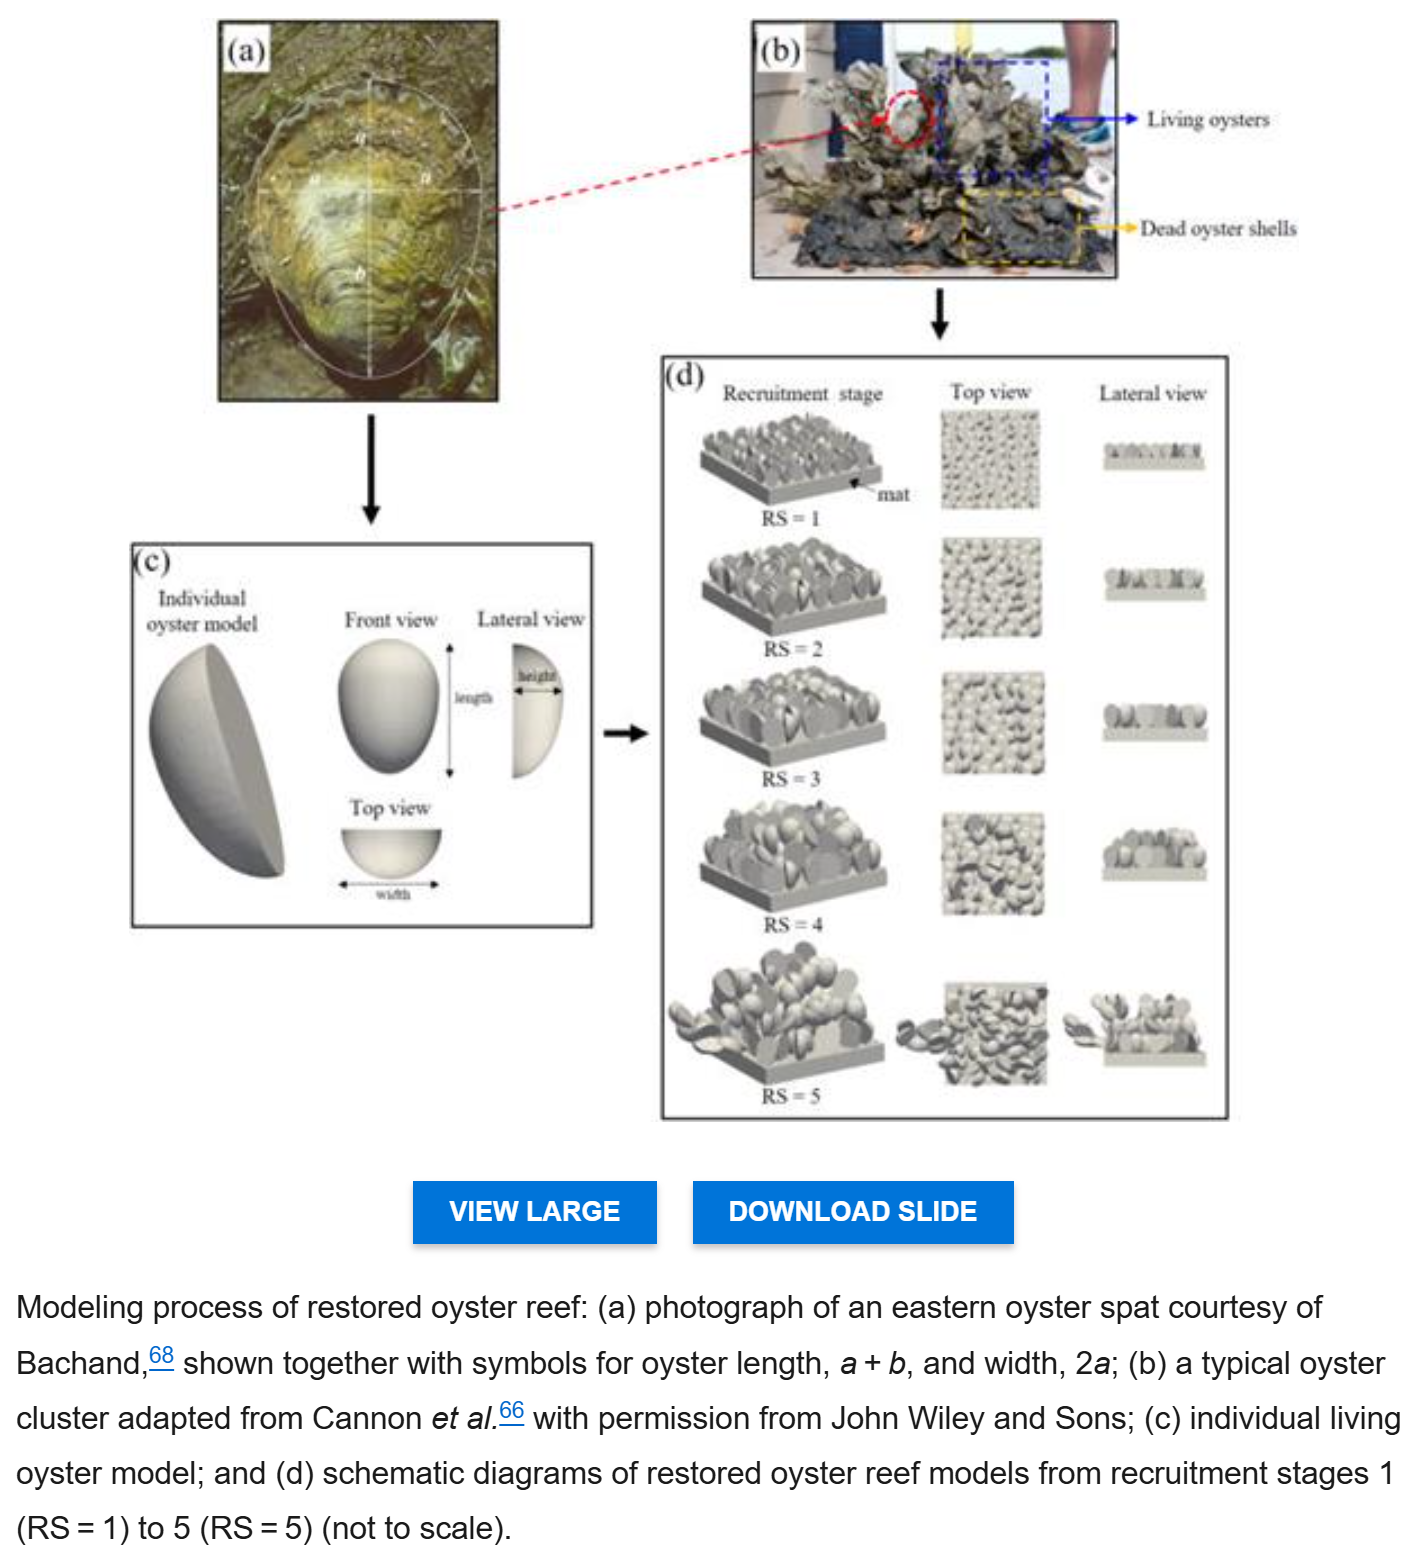
- Species: Ostrea angasi, Pacific Oyster (Magellana gigas, an invasive species in Australia).
- Shell shape (overall, patterning, microstructure).
- Shell growth rate per year (linear or not?).
- Points of attachment.
- Density of attachment.
- Pattern of close growth.
- Shape/character of the host site (e.g. rock, shell, etc.).
Algorithms:
- Ingest the base geometry of the host site.
- Distribute the points of growth and original orientation of the oysters.
- a. Random distribution with falloffs or probabilities.
- b. Patterned distribution based on observed data.
- c. Simulation of spawning, fertilization, and settlement processes using probabilistic models and fluid dynamics to simulate larval dispersal and settlement patterns.
- Grow based on growth rates and patterns, accounting for factors such as competition for space.
- Simulate long-term dynamics, taking into account water levels, mortality rates, storm damage, etc.
Outputs:
- 3D models of the reef structure at various time points, including long-term projections, e.g. 10, 20, 50 years.
- Comparative analysis for different species, growth patterns, and host site characteristics.
Assessment of Consequences
- Total volume, surface area, and weight.
- Habitat complexity.
- Oyster density and biomass.
- Motile and sessile epifauna response.
- Water filtration, shoreline protection, carbon sequestration, and other ecosystem services.
- Sediment interaction and burial resistance.
- On-structure performance versus whole-project efficiency. Distinguish density on each structure from oysters per restored area or per substrate volume. These objectives can favour different designs.
- Cost comparison of oyster reef structures and alternative shoreline or habitat solutions.
Glossary
Cultch refers to the hard materials that oyster larvae settle on, mainly dead oyster shells and shell fragments, and sometimes other durable hard substrates.
Depensation is a process in which per‑capita survival, growth, or reproduction declines as population density becomes very low.
Epifauna comprise surface‑dwelling animals associated with hard substrates, including reef‑building and reef‑associated structures.
Motile epifauna (e.g. crabs, snails) and sessile epifauna (e.g. barnacles, sponges).
References
Barclay, James, Andrew W. M. Pomeroy, Brendan Scott Lanham, Ben L. Gilby, Victoria J. Cole, and Rebecca L. Morris. “Linking Oyster Reef Spatial Complexity to Sediment Patterns Using UAV Imagery.” Preprint, SSRN, 2026. https://doi.org/10.2139/ssrn.6251787. [The Sydney rock oyster (Saccostrea glomerata)]
Barclay, James, Jan Hitzegrad, Kara Keimer, Brendan S. Lanham, Andrew W. M. Pomeroy, Oliver Lojek, Nils Goseberg, and Rebecca L. Morris. “Intra-Reef Surface Complexity of the Oyster Saccostrea Glomerata and Its Influence on Surrounding Flow.” Estuaries and Coasts 48, no. 4 (2025): 102. https://doi.org/10.1007/s12237-025-01535-y. [Sydney rock oyster (Saccostrea glomerata)]
Caretti, Olivia N., David B. Eggleston, Brandon J. Puckett, and DelWayne R. Bohnenstiehl. “Location and Reef Size Drive Oyster Reef Restoration Success.” Restoration Ecology 32, no. 5 (2024): e14168. https://doi.org/10.1111/rec.14168. [Pamlico Sound, North Carolina, United States]
Esquivel-Muelbert, Juan R., Luisa Fontoura, Kyle Zawada, Katherine Erickson, William Figueira, Joshua S. Madin, and Melanie J. Bishop. “The Natural Architecture of Oyster Reefs Maximizes Recruit Survival.” Nature, 2026, 1–5. https://doi.org/10/hbpxtt. [Saccostrea glomerata, New South Wales, Australia]
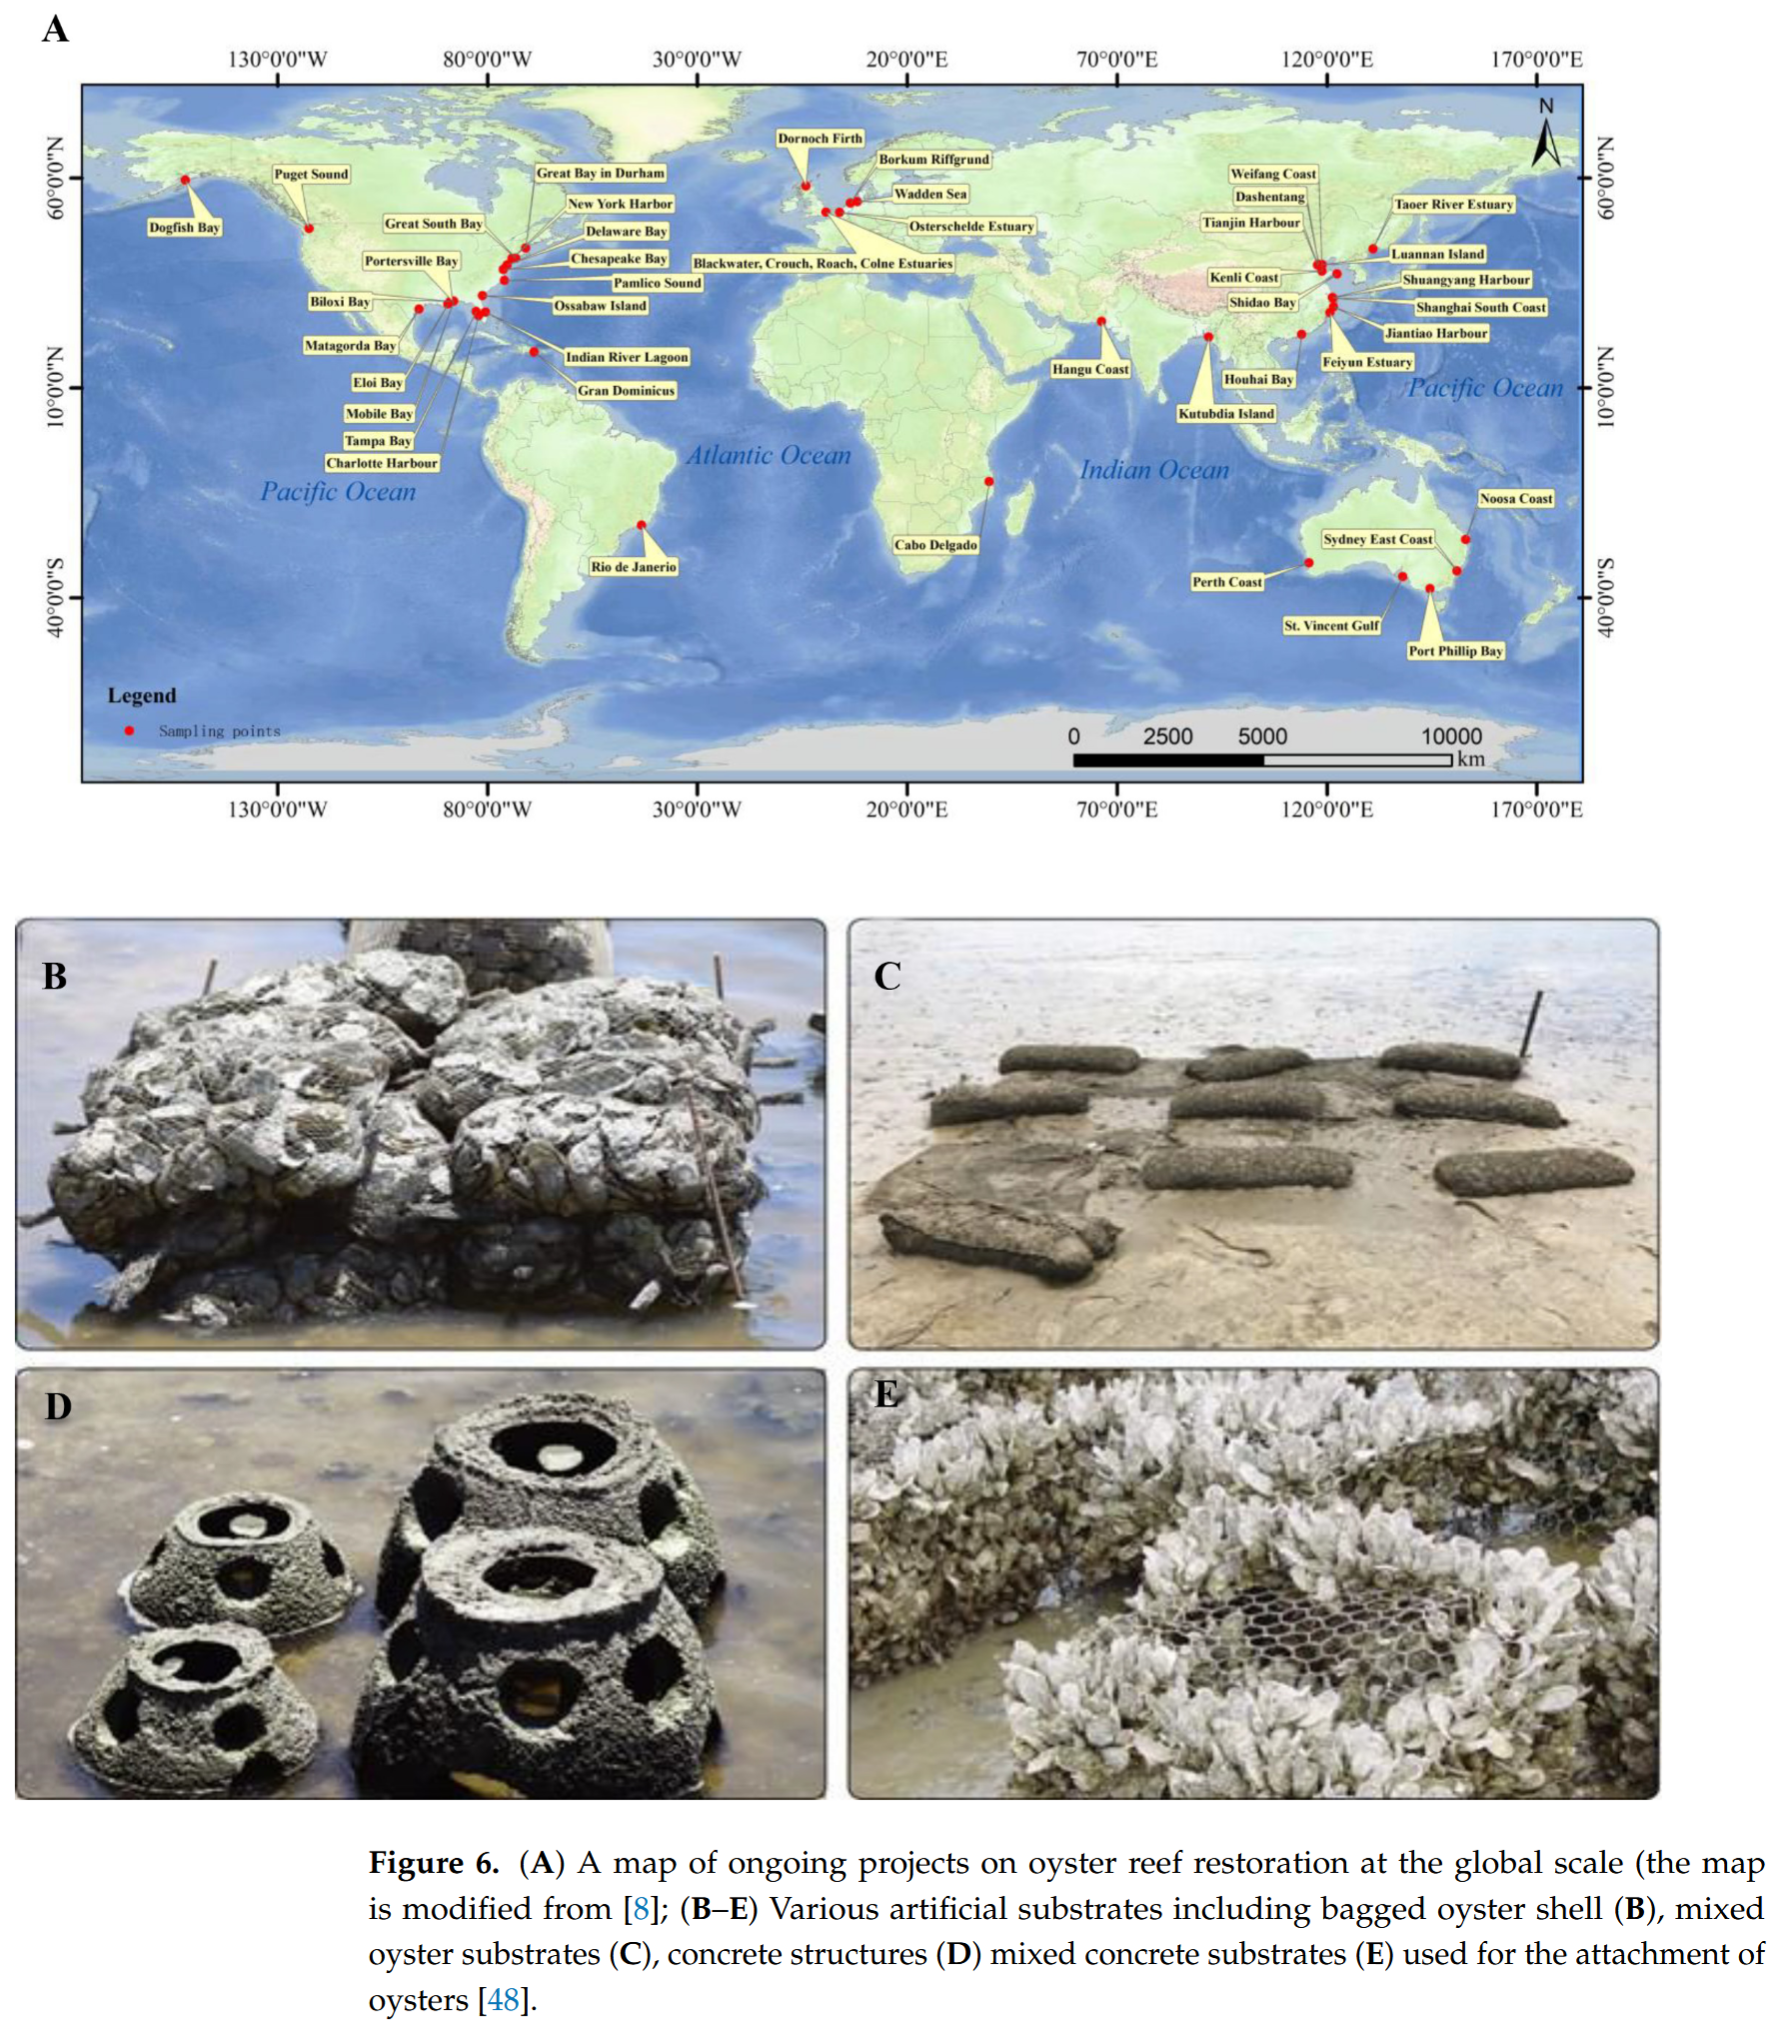
Jamil, Asad, Ambreen Ahmad, Yong Zhao, Yuxuan Zhao, Chen Yang, Yanping Li, Jianbo Tu, Fuxin Niu, Wenliang Kong, and Xianhua Liu. “Advances in Global Oyster Reef Restoration: Innovations and Sustainable Ecological Approaches.” Sustainability 16, no. 22 (2024). https://doi.org/10.3390/su16229795. [Global]
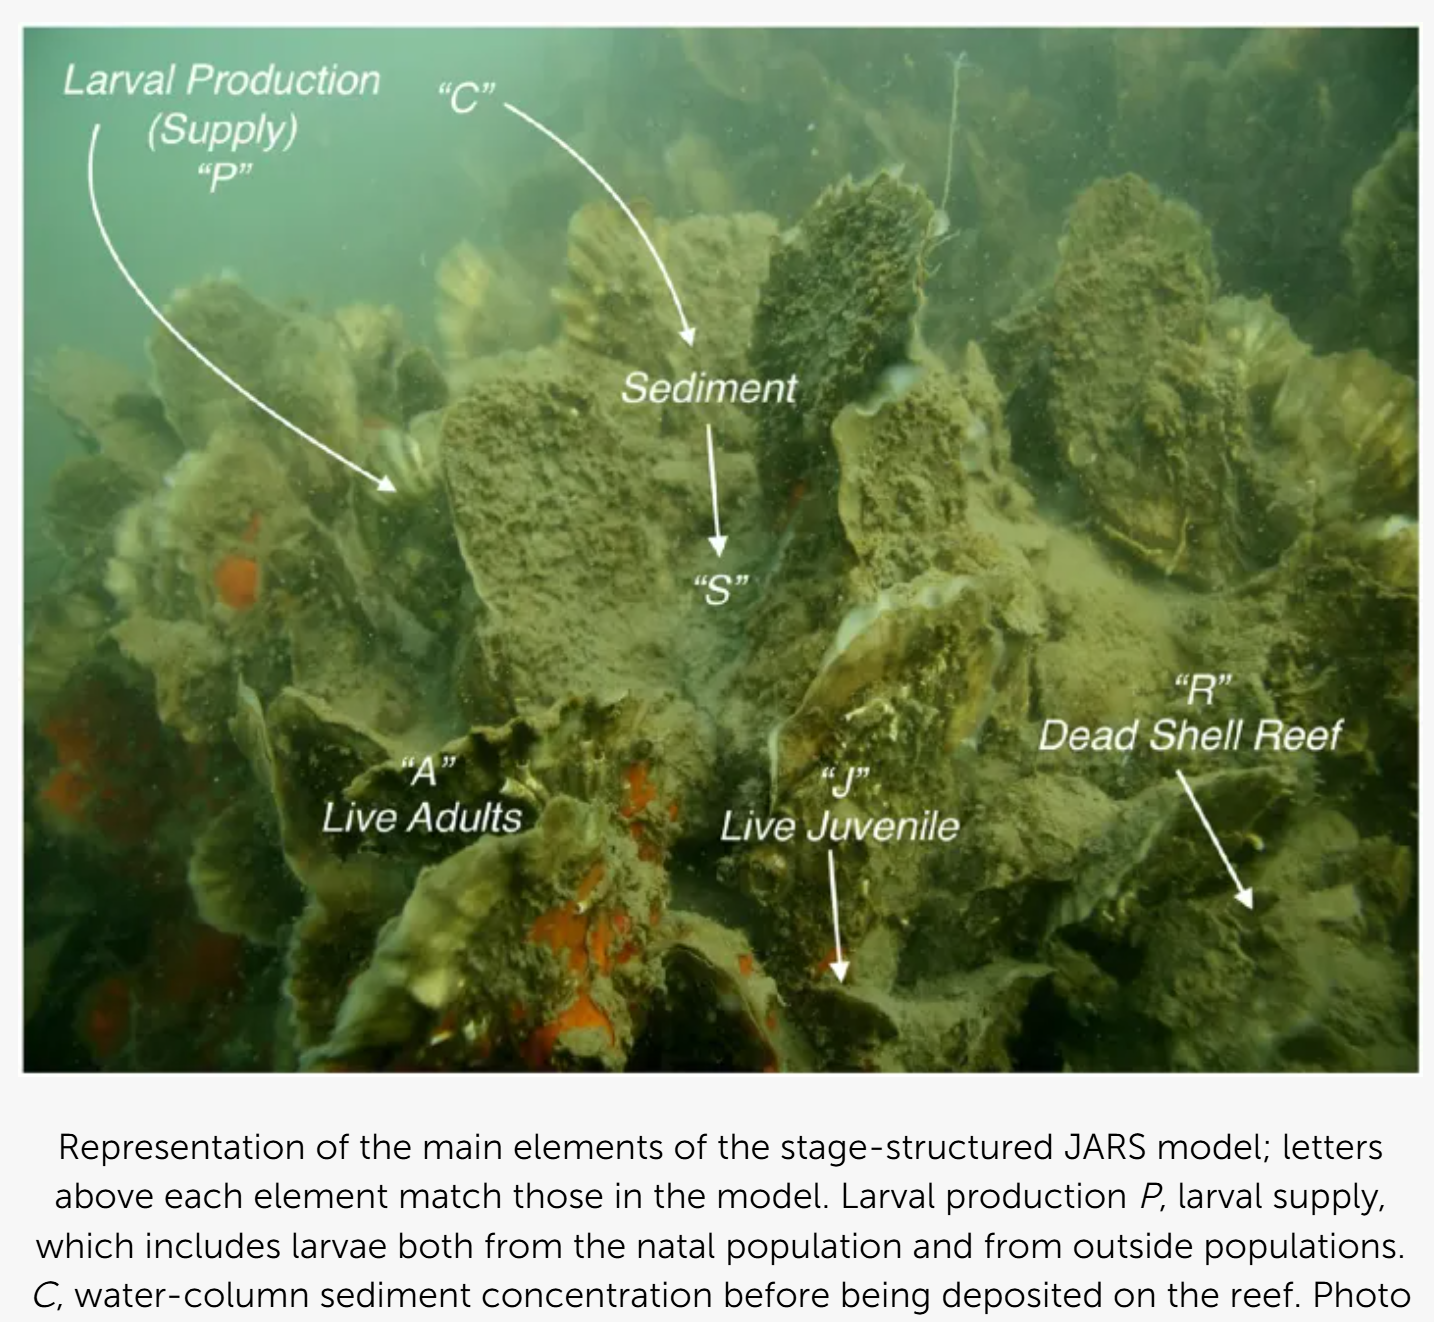
Lipcius, Romuald N., Yi Zhang, Jingyi Zhou, Leah B. Shaw, and Junping Shi. “Modeling Oyster Reef Restoration: Larval Supply and Reef Geometry Jointly Determine Population Resilience and Performance.” Frontiers in Marine Science 8 (2021). https://doi.org/10.3389/fmars.2021.677640. [(Crassostrea virginica), , USA]
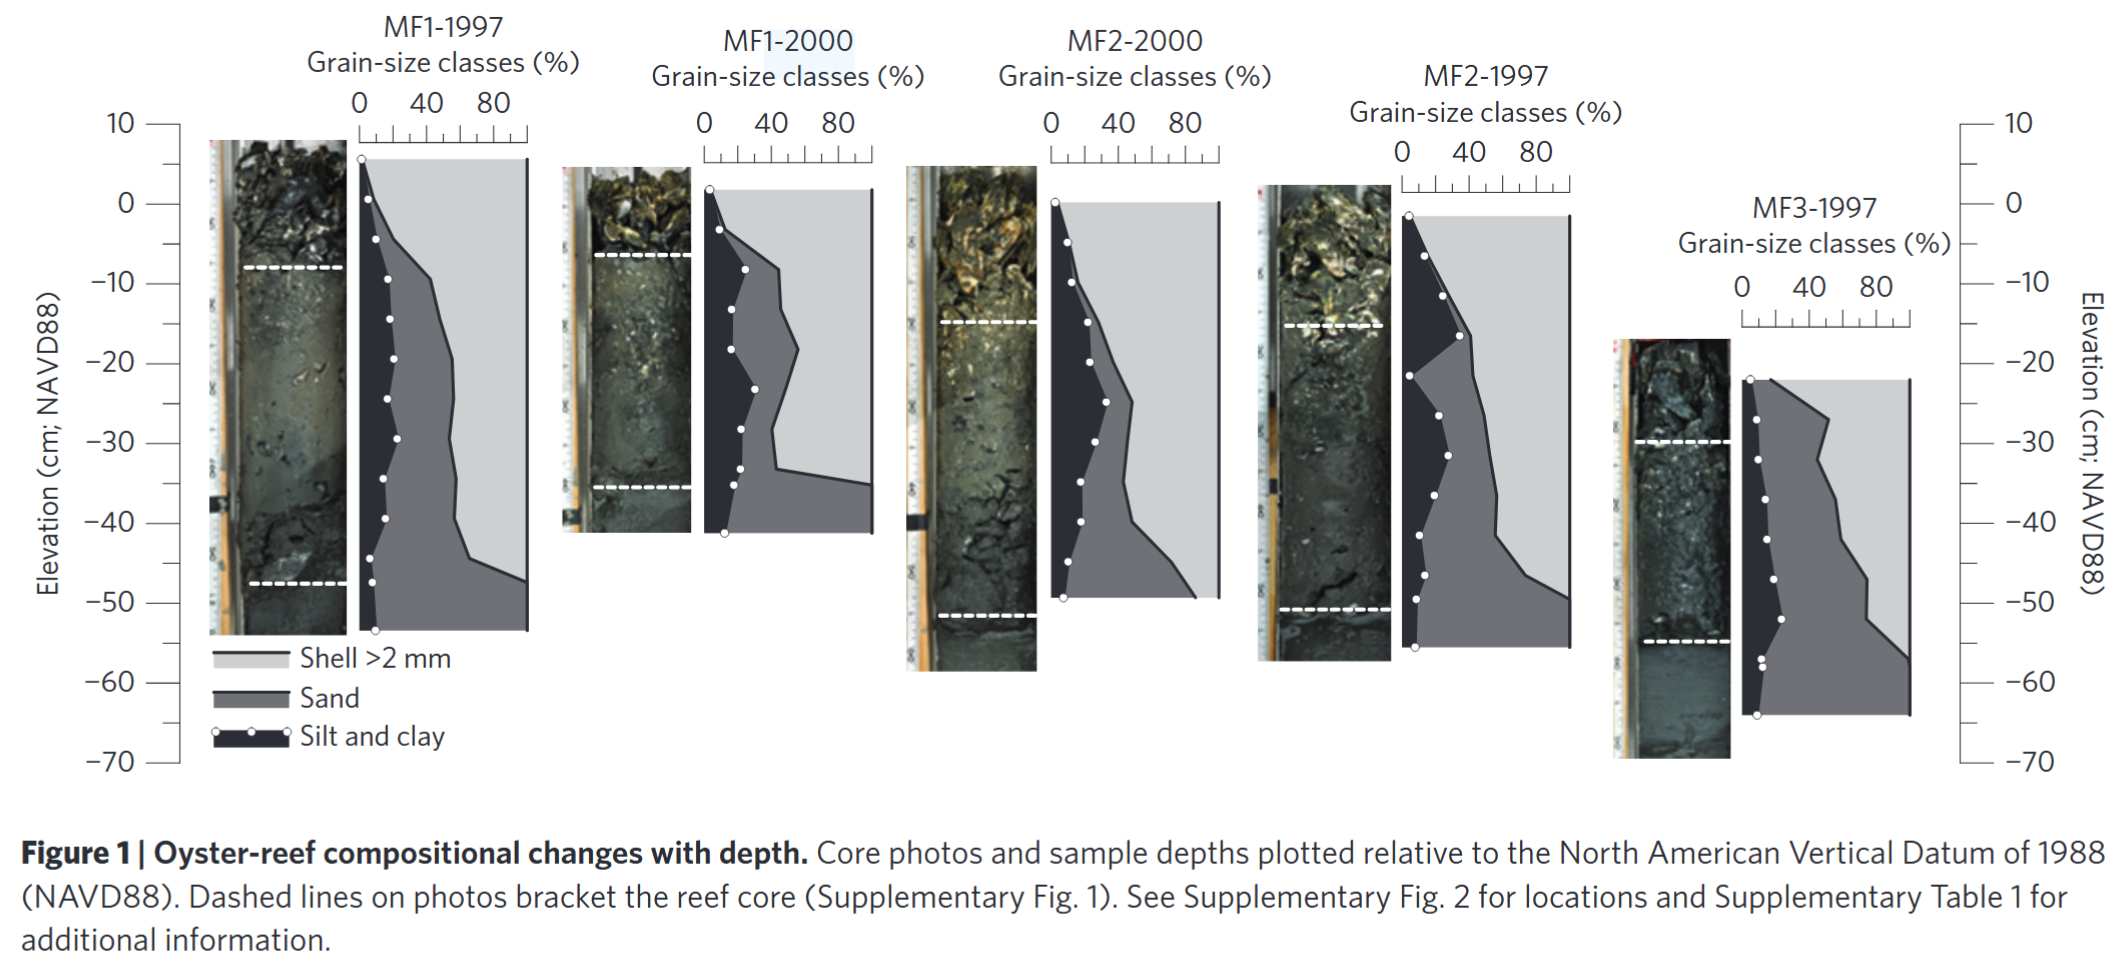
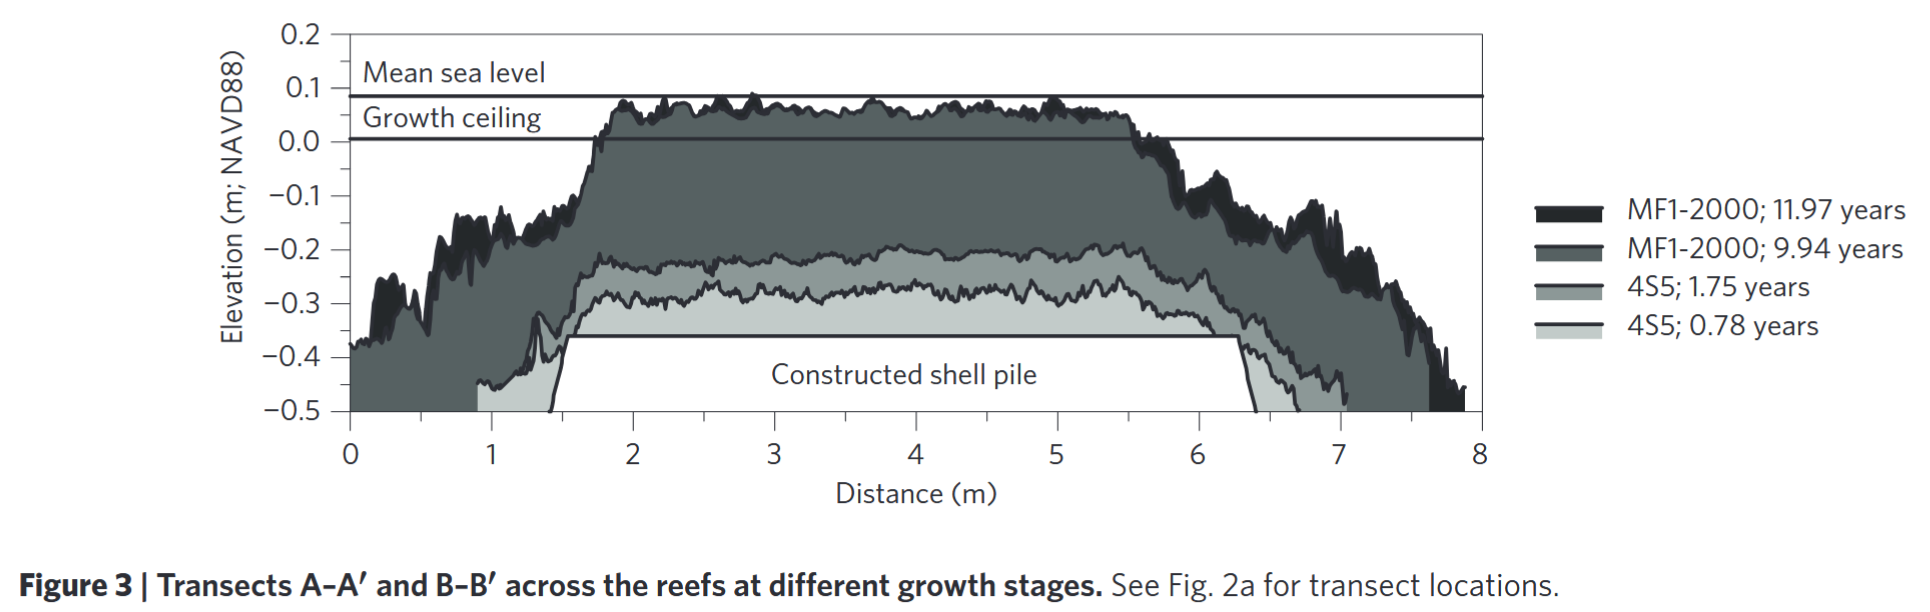
Rodriguez, Antonio B., F. Joel Fodrie, Justin T. Ridge, Niels L. Lindquist, Ethan J. Theuerkauf, Sara E. Coleman, Jonathan H. Grabowski, et al. “Oyster Reefs Can Outpace Sea-Level Rise.” Nature Climate Change 4, no. 6 (2014): 493–97. https://doi.org/10.1038/nclimate2216.y [Crassostrea virginica, USA]
Williams, Brittany R., Dominic McAfee, and Sean D. Connell. “Oyster Larvae Swim along Gradients of Sound.” Journal of Applied Ecology 59, no. 7 (2022): 1815–24. https://doi.org/10.1111/1365-2664.14188. [Ostrea angasi]
Wu, Fei, Zegao Yin, Yanxu Wang, and Xiutao Jiang. “Numerical Investigation of the Restored Oyster Reef Flow Field with the Lattice Boltzmann Method.” Physics of Fluids 36, no. 4 (2024): 047111. https://doi.org/10.1063/5.0199179. [Generic]
Quan, Weimin, Nannan Li, Qing Liu, Boze Hancock, Qi Liu, Wenwu Zhao, Wenjun Ma, et al. “Oyster Reef Restoration in a Subtropical Bay in China: Effects of Tidal Elevation, Reef Microhabitats and Size on Oysters and Resident Macrofaunal Communities.” Marine Ecology Progress Series 765 (2025): 39–52. https://doi.org/10.3354/meps14892. [A non-native oyster (Crassostrea hongkongensis) and 3 native oysters (C. ariakensis, C. sikamea and C. angulata), China]
Zhuang, Jiaquan, Qian Yu, Yidong Guo, Yun Peng, Yanan Li, and Yunwei Wang. “Decoding Intertidal Oyster Reef Morphology: Insights from UAV Photogrammetry and Deep Learning.” Marine Geology 480 (2025): 107462. https://doi.org/10.1016/j.margeo.2024.107462. [Crassostrea ariakensis, China]
Backlinks